转载请说明。
R语言官网:http://www.r-project.org/
R语言软件下载:http://ftp.ctex.org/mirrors/CRAN/ 注:下载时点击 install R for the first time
下面进行一个简单的入门程序学习。
先新建一个txt,叫做 Rice_insect.txt,内容为:
|
1
2
3
4
5
6
7
8
9
10
11
12
13
14
15
16
17
18
19
20 |
Year Adult Day Precipitation1973 27285 15 387.31974 239 14 126.31975 6164 11 165.91976 2535 24 184.91977 4875 30 166.91978 9564 24 146.01979 263 3 24.01980 3600 21 23.01981 21225 13 167.01982 915 12 67.01983 225 17 307.01984 240 40 295.01985 5055 25 266.01986 4095 15 115.01987 1875 21 140.01988 12810 32 369.01989 5850 21 167.01990 4260 39 270.8 |
Adult为累计蛾量,Day为降雨持续天数,Precipitation为降雨量。
输入代码:
|
1
2
3
4
5
6
7 |
library(mgcv) #加载mgcv软件包,因为gam函数在这个包里Data <- read.delim("Rice_insect.txt") #读取txt数据,存到Data变量中Data <- as.matrix(Data) #转为矩阵形式#查看Data数据:Data,查看第2列:Data[,2],第2行:Data[2,]result1 <- gam(log(Adult) ~ s(Day)) #此时,Adult为相应变量,Day为解释变量summary(result1) #输出计算结果 |
此时可以看到:
Family: gaussian
Link function: identityFormula:
log(Adult) ~ s(Day)Parametric coefficients:
Estimate Std. Error t value Pr(>|t|)
(Intercept) 7.9013 0.3562 22.18 4.83e-13 ***
---
Signif. codes: 0 ‘***’ 0.001 ‘**’ 0.01 ‘*’ 0.05 ‘.’ 0.1 ‘ ’ 1Approximate significance of smooth terms:
edf Ref.df F p-value
s(Day) 1.713 2.139 0.797 0.473R-sq.(adj) = 0.0471 Deviance explained = 14.3%
GCV score = 2.6898 Scale est. = 2.2844 n = 18
Day的影响水平p-value=0.473,解释能力为14.3%,说明影响不明显。
其中,edf为自由度,理论上,当自由度接近1时,表示是线性关系;当自由度比1大,则表示为曲线关系。
接下来使用另一个解释变量Precipitation。输入代码:
|
1
2 |
result2 <- gam(log(Adult) ~ s(Precipitation)) summary(result2) |
发现:
Family: gaussian
Link function: identityFormula:
log(Adult) ~ s(Precipitation)Parametric coefficients:
Estimate Std. Error t value Pr(>|t|)
(Intercept) 7.9013 0.2731 28.94 1.87e-12 ***
---
Signif. codes: 0 ‘***’ 0.001 ‘**’ 0.01 ‘*’ 0.05 ‘.’ 0.1 ‘ ’ 1Approximate significance of smooth terms:
edf Ref.df F p-value
s(Precipitation) 5.022 6.032 2.561 0.0774 .
---
Signif. codes: 0 ‘***’ 0.001 ‘**’ 0.01 ‘*’ 0.05 ‘.’ 0.1 ‘ ’ 1R-sq.(adj) = 0.44 Deviance explained = 60.6%
GCV score = 2.0168 Scale est. = 1.342 n = 18
此时p-value为0.0774,说明该因子在P<0.1水平下影响显著。(一般情况下p<0.05为显著。)
接下来画图:
|
1 |
plot(result2,se=T,resid=T,pch=16) |
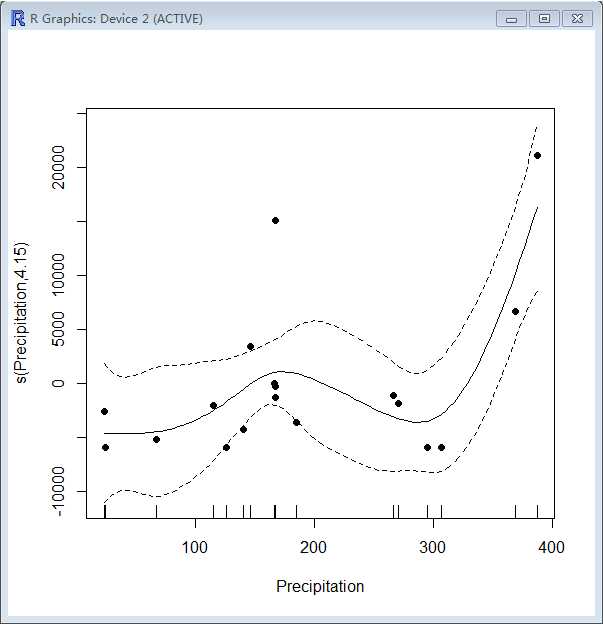
pch=16这个是图标的序号,比如改成17就是三角形了。
log(Adult)中的log是什么意思呢?
log是数据变换,取对数可以把大范围的数变成小范围的数,这在将几组相差太大的数据画在同一个坐标轴时特别有用,比如一组数据范围是1~10,第二组数据范围是10~100000000,要是不对第二组取常用对数,第一组在坐标轴上只是一点点,都看不到,对第二组取常用对数后,第二组范围变成1~8了,这样两组数据都能看到了。
下面尝试将两个变量同时作为解释变量。
|
1 |
result3<-gam(log(Adult)~s(Precipitation)+s(Day)) |
出错:Model has more coefficients than data
解决办法:改成:
|
1 |
result3<-gam(log(Adult)~s(Precipitation,k=9)+s(Day,k=9)) |
k是什么?
k is the dimension of the basis used to represent the smooth term. If k is not specified then basis specific defaults are used.
K的最小值是3,最大值是17,为3、4的时候都是直线,说明太小了体现不出来,在不断增大的过程中发现,K越大,曲线原来越平滑,再大时,曲线就出现了一些弯曲,说明更精准了,再大时,图形就基本不变了,说明也没必要设那么大了。
再
|
1 |
summary(result3) |
结果:
Family: gaussian
Link function: identityFormula:
log(Adult) ~ s(Precipitation, k = 9) + s(Day, k = 9)Parametric coefficients:
Estimate Std. Error t value Pr(>|t|)
(Intercept) 7.9013 0.2831 27.91 8.16e-12 ***
---
Signif. codes: 0 ‘***’ 0.001 ‘**’ 0.01 ‘*’ 0.05 ‘.’ 0.1 ‘ ’ 1Approximate significance of smooth terms:
edf Ref.df F p-value
s(Precipitation) 4.653 5.572 2.546 0.0848 .
s(Day) 1.000 1.000 0.500 0.4939
---
Signif. codes: 0 ‘***’ 0.001 ‘**’ 0.01 ‘*’ 0.05 ‘.’ 0.1 ‘ ’ 1R-sq.(adj) = 0.398 Deviance explained = 59.8%
GCV score = 2.288 Scale est. = 1.4423 n = 18
R语言基础包函数中文帮助文档(中英文对照v10) http://www.docin.com/p-585638419.html
R语言:formula.gam()函数中文帮助文档 http://www.biostatistic.net/thread-6589-1-45.html
R语言 mgcv包 gam()函数中文帮助文档 http://www.biostatistic.net/thread-56086-1-1.html
R语言实现 广义加性模型 Generalized Additive Models(GAM) 入门,布布扣,bubuko.com
R语言实现 广义加性模型 Generalized Additive Models(GAM) 入门
原文:http://www.cnblogs.com/caroar/p/3641671.html