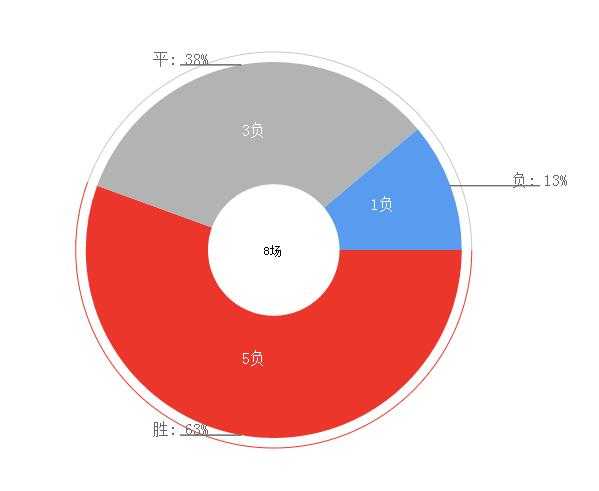
自己做了个环形饼图 用于球队之间胜平负显示:
源代码:

  1 //饼图
  2 var pieChart = {
  3     width: 600,
  4     height: 400,
  5     series: [],
  6     unit: "场",
  7     chartCanvas: null,
  8     selectable : true,
  9     title: "Pie Chart",
 10     legend : {
 11         enable : true
 12     },
 13     edge : {
 14         width: 40,
 15         height: 40
 16     },
 17     animation: {
 18         enable: true,
 19         animCanvas : null,
 20         hh: 1, // trick is here!! for animation play
 21         pctx: null
 22     },
 23     tooltips: {
 24         enable: true,
 25         tooltipCanvas : null,
 26         ttContext: null,
 27         index: -1
 28     },
 29     circle : {
 30         cx: 0,
 31         cy: 0,
 32         radius: 0
 33
 34     },
 35     text : {
 36         enable: false,
 37         content:[]
 38     },
 39
 40     init: function (config) {
 41         this.chartCanvas = config.canvas;
 42         this.chartCanvas.width = config.width;
 43         this.chartCanvas.height = config.height;
 44         this.width = config.width ;
 45         this.height = config.height ;
 46         this.series = config.series;
 47         this.title = config.title;
 48         this.unit = config.unit;
 49         this.count =  config.count;
 50         this.max = config.max;
 51         this.shadow = config.shadow;
 52
 53         var ctx = this.chartCanvas.getContext("2d");
 54         this.devicePixelRatio = window.devicePixelRatio || 1;
 55         this.backingStoreRatio = ctx.webkitBackingStorePixelRatio ||
 56                             ctx.mozBackingStorePixelRatio ||
 57                             ctx.msBackingStorePixelRatio ||
 58                             ctx.oBackingStorePixelRatio ||
 59                             ctx.backingStorePixelRatio || 1;
 60         this.devicePixelRatio = this.devicePixelRatio/this.backingStoreRatio;
 61         this.chartCanvas.height = this.height * this.devicePixelRatio;
 62         this.chartCanvas.width = this.width * this.devicePixelRatio;
 63
 64         this.chartCanvas.style.height = this.height  + "px";
 65         this.chartCanvas.style.width = this.width  + "px";
 66         this.width = config.width * this.devicePixelRatio-5* this.devicePixelRatio;
 67         this.height = config.height * this.devicePixelRatio;
 68         this.edge.width = 40 * this.devicePixelRatio;
 69         this.edge.height = 40 * this.devicePixelRatio;
 70         if(config.tooltips != undefined) {
 71             this.tooltips.enable = config.tooltips.enable;
 72         }
 73         if(config.animation != undefined) {
 74             this.animation.enable = config.animation.enable;
 75         }
 76         if(config.legend != undefined) {
 77             this.legend.enable = config.legend.enable;
 78         }
 79         if(config.text != undefined) {
 80             this.text.enable = config.text.enable;
 81         }
 82         this.render();
 83     },
 84
 85     render : function() {
 86         // initialization circle
 87         this.circle.cx = this.width/2.15;
 88         this.circle.cy = this.height/2;
 89         this.circle.radius = Math.min(this.width/2, this.height/2) - 12*this.devicePixelRatio;
 90         var ctx = null;
 91         if(this.animation.enable) {
 92             this.animation.animCanvas = document.createElement("canvas");
 93             this.animation.animCanvas.width = this.width;
 94             this.animation.animCanvas.height = this.height;
 95             ctx = this.animation.animCanvas.getContext("2d");
 96         } else {
 97             ctx = this.chartCanvas.getContext("2d");
 98             this.renderBorder(ctx);
 99         }
100
101         if(this.circle.radius <= 0) {
102             ctx.strokeText("Can not reader the chart, Circle is too small.");
103             return;
104         }
105
106         // draw each arc according to data series
107         var sum = 0;
108         var nums = this.series.length;
109         for(var i=0; i<nums; i++) {
110             sum += this.series[i].value;
111         }
112
113         // draw title
114         var pt = 18*this.devicePixelRatio;
115         ctx.font = pt+‘px Microsoft YaHeii‘;
116         ctx.fillText(this.title, this.width/2 - this.edge.width, 30);
117         ctx.save();
118         var deltaArc = 0;
119         for(var i=0; i<nums; i++) {
120             var precent = this.series[i].value/sum;
121             this.renderPie(ctx, i, precent, deltaArc);
122             deltaArc += 2*Math.PI * precent;
123         }
124         ctx.restore();
125
126         if(this.shadow){
127             // add blur shadow
128             ctx.save();
129             ctx.shadowColor = "black";
130             ctx.shadowOffsetX = 0;
131             ctx.shadowOffsetY = 0;
132             ctx.shadowBlur = 10;
133             ctx.beginPath();
134             ctx.arc(this.circle.cx, this.circle.cy, this.circle.radius, 0, Math.PI * 2, false);
135             ctx.closePath();
136             ctx.lineWidth = 1;
137             ctx.strokeStyle = "RGBA(127,127,127,1)";
138             ctx.stroke();
139             ctx.restore();
140         }
141
142         // 画内部空白
143         ctx.beginPath();
144         ctx.moveTo(this.circle.cx, this.circle.cy);
145         ctx.arc(this.circle.cx, this.circle.cy, this.circle.radius*0.35, 0, Math.PI * 2, true);
146         ctx.closePath();
147         ctx.fillStyle = ‘rgba(255,255,255,1)‘;
148         ctx.fill();
149
150         ctx.moveTo(this.circle.cx-10*this.devicePixelRatio, this.circle.cy);
151         //ctx.font = ‘bold 12px 微软雅黑‘;    //斜体 30像素 微软雅黑字体
152         var pt = 12*this.devicePixelRatio;
153         ctx.font = pt+‘px Microsoft YaHeii‘;
154         ctx.fillStyle = "black"; //"#000000";
155         var percent = this.count+this.unit;
156             ctx.fillText(percent,this.circle.cx-10*this.devicePixelRatio, this.circle.cy+5*this.devicePixelRatio);
157
158         // render legend
159         ctx.save();
160         this.renderLegend(ctx, sum);
161         ctx.restore();
162
163         // play animation
164         if(this.animation.enable) {
165             var parent = this;
166             this.animation.pctx = this.chartCanvas.getContext("2d");
167             this.renderBorder(this.animation.pctx);
168            setTimeout(function(){ parent.playAnimation(parent);},0)
169         }
170     },
171
172     showTooltips : function(loc, ctx) {
173         if(!this.tooltips.enable) {
174             return;
175         }
176         var dx = loc.x - this.width/2;
177         var dy = loc.y - this.height/2;
178         var dis = Math.floor(Math.sqrt(dx * dx + dy * dy));
179         if(dis <= this.circle.radius) {
180             // draw tool tip text
181             var angle = Math.atan2(dy,dx);
182             if(angle <= 0) {
183                 // if[-Math.PI, 0], make it[Math.PI, 2*Math.PI]
184                 angle = angle + 2*Math.PI;
185             }
186
187             var sum = 0;
188             var nums = this.series.length;
189             for(var s=0; s<nums; s++) {
190                 sum += this.series[s].value;
191             }
192
193             var deltaArc = 0;
194             var index = 0;
195             for(var i=0; i<nums; i++) {
196                 var precent = this.series[i].value/sum;
197                 deltaArc += 2*Math.PI * precent;
198                 if(angle<=deltaArc) {
199                     index = i;
200                     break;
201                 }
202             }
203             if(this.tooltips.tooltipCanvas == null) {
204                 this.tooltips.tooltipCanvas = document.createElement("canvas");
205                 this.tooltips.ttContext = this.tooltips.tooltipCanvas.getContext("2d");
206                 this.tooltips.tooltipCanvas.width = 150;
207                 this.tooltips.tooltipCanvas.height = 100;
208             }
209
210             // only draw once
211             // if(index == this.tooltips.index){
212             //  return;
213             // }
214             this.clearTooltips(ctx);
215
216             this.tooltips.index = index;
217             var m_context = this.tooltips.ttContext;
218             m_context.save();
219             m_context.clearRect(0, 0, this.tooltips.tooltipCanvas.width, this.tooltips.tooltipCanvas.height);
220             m_context.lineWidth = 2;
221             m_context.strokeStyle = this.series[index].color;
222             m_context.fillStyle="RGBA(255,255,255,0.7)";
223             // m_context.strokeRect(2, 2, this.tooltips.tooltipCanvas.width-4, this.tooltips.tooltipCanvas.height-4);
224             // m_context.fillRect(2,2,this.tooltips.tooltipCanvas.width-4, this.tooltips.tooltipCanvas.height-4);
225             //m_context.font="14px Arial";
226             var pt = 14*this.devicePixelRatio;
227             m_context.font = pt+‘px Microsoft YaHeii‘;
228             m_context.fillStyle="RGBA(0,0,0,1)";
229             m_context.fillText(this.series[index].name + ": " + this.series[index].value + this.unit, 5, 40);
230             m_context.restore();
231
232             // make tool-tip rectangle is always visible
233             if((loc.x + this.tooltips.tooltipCanvas.width)> this.width) {
234                 loc.x = loc.x - this.tooltips.tooltipCanvas.width;
235             }
236             if((loc.y - this.tooltips.tooltipCanvas.height) <= 0) {
237                 loc.y = loc.y + this.tooltips.tooltipCanvas.height;
238             }
239             ctx.drawImage(this.tooltips.tooltipCanvas, 0, 0, this.tooltips.tooltipCanvas.width, this.tooltips.tooltipCanvas.height,
240                     loc.x, loc.y-this.tooltips.tooltipCanvas.height, this.tooltips.tooltipCanvas.width, this.tooltips.tooltipCanvas.height);
241         } else {
242             this.tooltips.index = -1;
243             this.clearTooltips(ctx);
244         }
245     },
246
247     clearTooltips : function(ctx) {
248         ctx.clearRect(0,0,this.width, this.height);
249         this.renderBorder(ctx);
250         ctx.drawImage(this.animation.animCanvas, 0, 0, this.width, this.height, 0, 0, this.width, this.height);
251     },
252
253     renderBorder : function(ctx) {
254         //canvas 边框
255         //ctx.save();
256         //ctx.fillStyle="white";
257         //ctx.strokeStyle="black";
258         //ctx.fillRect(0, 0, this.width, this.height);
259         //ctx.strokeRect(0, 0, this.width, this.height);
260         //ctx.restore();
261     },
262
263     renderPie : function(ctx, index, precent, deltaArc) {
264         var endAngle = deltaArc + 2*Math.PI*precent;
265         ctx.lineWidth=this.devicePixelRatio;
266         ctx.beginPath();
267         ctx.arc(this.circle.cx, this.circle.cy, this.circle.radius, deltaArc, endAngle, false);
268         ctx.moveTo(this.circle.cx, this.circle.cy);
269         ctx.lineTo(this.circle.cx + this.circle.radius * Math.cos(deltaArc), this.circle.cy + this.circle.radius * Math.sin(deltaArc));
270         ctx.lineTo(this.circle.cx + this.circle.radius * Math.cos(endAngle), this.circle.cy + this.circle.radius * Math.sin(endAngle));
271         ctx.lineTo(this.circle.cx, this.circle.cy);
272         ctx.closePath();
273         ctx.fillStyle = this.series[index].color;
274         ctx.fill();
275         //外圈大圆
276         ctx.beginPath();
277         ctx.arc(this.circle.cx, this.circle.cy, this.circle.radius+10*this.devicePixelRatio, deltaArc, endAngle, false);
278         if(this.max == index){
279             //最大弧度使用颜色标识
280             ctx.strokeStyle = this.series[index].color;
281         }else{
282             ctx.strokeStyle = "#CCC5C5";
283         }
284         ctx.stroke();
285         // 渲染文字
286         if(this.text.enable) {
287             var zeroCount = 0;
288             for(var zz = 0; zz < this.series.length; zz++){
289                 if(this.series[zz].value == 0)zeroCount++;
290             }
291             var halfEndAngle = deltaArc + Math.PI*precent;
292             var hx = this.circle.cx + this.circle.radius * Math.cos(halfEndAngle);
293             var hy = this.circle.cy + this.circle.radius * Math.sin(halfEndAngle);
294             var linePos = (hx < this.circle.cx) ? (hx - this.edge.width)*0.9 : (hx + this.edge.width)*1.1 ;
295             ctx.beginPath();
296             ctx.moveTo(hx, hy);
297             ctx.lineTo(linePos, hy);
298             ctx.closePath();
299             ctx.strokeStyle="#666";
300             ctx.stroke();
301
302             var avgx = Math.abs(hx - this.circle.cx)/2.6;
303             var avgy = Math.abs(hy - this.circle.cy)/2.6;
304             var textPos = (hx < this.circle.cx) ? (hx - this.edge.width)*0.9 : (hx + this.edge.width)*1.1;
305             var textPosX = (hx < this.circle.cx) ? hx + avgx: hx - avgx;
306             var textPosY = (hy < this.circle.cy) ? hy + avgy : hy - avgy;
307             precent = Math.round (precent*100) / 100;
308             var size = this.text.content.length;
309             var tipStr = (size > index) ? this.text.content[index] : this.series[index].name + ": " + ((this.series[index].value/this.count)*100).toFixed(0) + "%";
310             var pt = 12*this.devicePixelRatio;
311             ctx.font = pt+‘pt Microsoft YaHeii‘;
312             ctx.fillStyle="#666";
313             if(this.series[index].value > 0){
314                 ctx.textAlign="center";
315                 ctx.fillText(tipStr, textPos, hy);
316             }
317             else{
318                 ctx.textAlign="center";
319                 var zerohy = (hy < this.circle.cy) ? hy+20*(index-1)*this.devicePixelRatio : hy+20*(index-1)*this.devicePixelRatio
320                 ctx.fillText(tipStr, textPos, zerohy);
321             }
322             //给圆环加文本
323             ctx.fillStyle="white";
324             if(this.series[index].name == "主胜"){
325                 tipStr = this.series[index].value + "胜"
326             }else if(this.series[index].name == "主平"){
327                 tipStr = this.series[index].value + "平"
328             }else{
329                 tipStr = this.series[index].value + "负"
330             }
331             ctx.textAlign="center";
332             if(this.series[index].value > 0)ctx.fillText(tipStr, textPosX, textPosY);
333         }
334     },
335
336     renderLegend : function(ctx, sum) {
337         if(!this.legend.enable) return;
338         var nums = this.series.length;
339         var pt = 12*this.devicePixelRatio;
340         ctx.font = pt+‘px Microsoft YaHeii‘;
341         var pos = (this.width/2 > (this.circle.radius+50 * this.devicePixelRatio)) ? 50*this.devicePixelRatio : (this.circle.cx - this.circle.radius);
342         for(var i=0; i<nums; i++) {
343             var x = this.series[i].value/sum;
344             x = Math.round (x*100) / 100;
345             var tipStr =  this.series[i].name + ": " + this.series[i].value + "场";
346             this.series[i].precent = tipStr;
347             ctx.fillStyle = this.series[i].color;
348             ctx.fillRect((pos - 40*this.devicePixelRatio), (20*i+10) * this.devicePixelRatio, 10 * this.devicePixelRatio, 10 * this.devicePixelRatio);
349             ctx.fillStyle = "black";
350             ctx.fillText(tipStr, (pos - 25*this.devicePixelRatio), (20*i+20) * this.devicePixelRatio);
351         }
352     },
353
354     playAnimation : function(parent) {
355         if(parent.animation.hh < parent.height) {
356             parent.animation.pctx.save();
357             parent.animation.pctx.globalAlpha=0.5;
358             parent.animation.pctx.clearRect(0,0,parent.width, parent.height);
359             parent.renderBorder(parent.animation.pctx);
360             parent.animation.pctx.drawImage(parent.animation.animCanvas, 0, 0, parent.width, this.animation.hh, 0, 0, parent.width, this.animation.hh);
361             parent.animation.hh = parent.animation.hh + 10;
362             parent.animation.pctx.restore();
363             setTimeout(function() {parent.playAnimation(parent);}, 0);
364         } else {
365             parent.animation.pctx.clearRect(0,0,parent.width, parent.height);
366             parent.renderBorder(parent.animation.pctx);
367             parent.animation.pctx.drawImage(parent.animation.animCanvas, 0, 0, parent.width, parent.height, 0, 0, parent.width, parent.height);
368
369             // enable tool-tip functionality
370             if(parent.animation.enable && parent.legend.enable) {
371                 parent.chartCanvas.addEventListener(‘mousemove‘, function(event) {
372                     var x = event.pageX;
373                     var y = event.pageY;
374                     var canvas = event.target;
375                     var bbox = canvas.getBoundingClientRect();
376                     var loc = { x: x - bbox.left * (canvas.width  / bbox.width),
377                             y: y - bbox.top  * (canvas.height / bbox.height)};
378
379                     parent.showTooltips(loc, (parent.animation.enable ? parent.animation.pctx : ctx));
380                 }, false);
381             }
382         }
383     }
384
385 };
 1 var canvas = document.getElementById("myCanvas");
 2         var seriesData = [{name:"胜", value:5, color:"#ec362c"},
 3                       {name:"平", value:3, color:"#b3b3b3"},
 4                       {name:"负", value:1, color:"#599bee"}]
 5         var config = {
 6                 width : 600 ,
 7                 height: 400,
 8                 series: seriesData,
 9                 canvas: canvas,
10                 count:8,
11                 max:0,
12                 unit: "场",
13                 title:"",
14                 shadow:false,
15                 legend : {
16                     enable : false
17                 },
18                 text : {
19                     enable: true
20                 },
21         };
22         pieChart.init(config);
调用方式:
最终效果:
原文:http://www.cnblogs.com/xk911/p/4877600.html
