$(function () {
    $(‘#container‘).highcharts({
        chart: {
            type: ‘column‘
        },
        xAxis: {
            categories: [‘Jan‘, ‘Feb‘, ‘Mar‘, ‘Apr‘, ‘May‘, ‘Jun‘, ‘Jul‘, ‘Aug‘, ‘Sep‘, ‘Oct‘, ‘Nov‘, ‘Dec‘]
        },

        plotOptions: {
            series: {
                states: {
                    hover: {
                        enabled: false
                    }
                }
            }
        },

        series: [{
            data: [29.9, 71.5, 106.4, 129.2, 144.0, 176.0, 135.6, 148.5, 216.4, 194.1, 95.6, 54.4]
        }]
    });
});
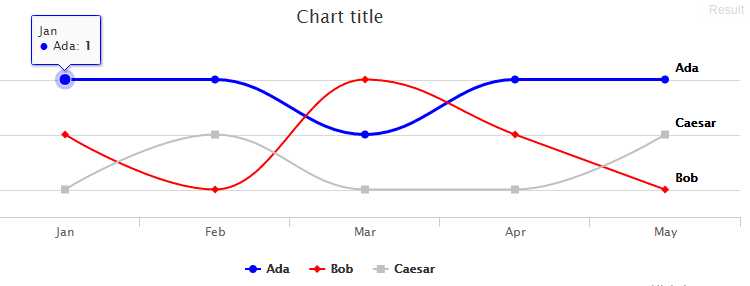
demo:http://jsfiddle.net/UyF9u/2/
var columns = [];
$.each([49.9, 71.5, 106.4, 129.2, 144.0, 176.0, 135.6, 148.5, 216.4, 194.1, 95.6, 54.4],function(i,v){
    columns.push({
        y: v,
        marker:{
            states:{
                hover:{
                    fillColor:"#ff0000",
                    backgroundColor:"#ff0000",
                    color: ‘#ff6600‘
                }
            }
        }
    });
});

$(function () {
        $(‘#container‘).highcharts({
            chart: {
                zoomType: ‘xy‘
            },
            title: {
                text: ‘Average Monthly Temperature and Rainfall in Tokyo‘
            },
            subtitle: {
                text: ‘Source: WorldClimate.com‘
            },
            tooltip: {
                shared: true
            },
            xAxis: false,
            yAxis: false,
            legend: {
                layout: ‘vertical‘,
                align: ‘left‘,
                x: 120,
                verticalAlign: ‘top‘,
                y: 100,
                floating: true,
                backgroundColor: ‘#FFFFFF‘
            },
            series: [{
                name: ‘Rainfall‘,
                color: ‘#E5E5E5‘,
                type: ‘column‘,
                data: columns,
                tooltip: {
                    valueSuffix: ‘ mm‘
                }
            }, {
                name: ‘Temperature‘,
                color: ‘#9B59B5‘,
                type: ‘spline‘,
                data: columns,
                tooltip: {
                    valueSuffix: ‘°C‘
                }
            }]
        });
    });
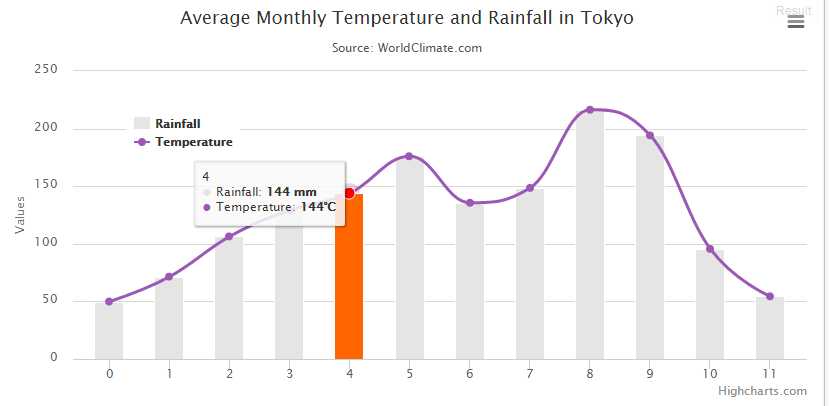
demo:http://jsfiddle.net/TheSharpieOne/DMcQ3/
原文:http://www.cnblogs.com/sanfense/p/highcharts.html