Classification is one of the major problems that we solve while working on standard business problems across industries. In this article we’ll be discussing the major three of the many techniques used for the same, Logistic Regression, Decision Trees and Support Vector Machines [SVM].
All of the above listed algorithms are used in classification [ SVM and Decision Trees are also used for regression, but we are not discussing that today!]. Time and again I have seen people asking which one to choose for their particular problem. Classical and the most correct but least satisfying response to that question is “it depends!”. Its downright annoying, I agree. So I decided to shed some light on it depends on what.
Its a very simplified 2-D explanation and responsibility of extrapolating this understanding to higher dimensional data, painfully lies in the reader’s hand.
I’ll start with discussing the most important question : what exactly are we trying do in classification? well, we are trying to classify.[ Is that a even serious questions? really?]. Let me rephrase that response. In order to classify , we try to get a decision boundary or a curve [ not necessarily straight], which separates two classes in our feature space.
Feature space sounds like a very fancy word and confusing to many who haven’t encountered it before. Let me show you an example which will clarify this . I have a sample data with 3 variables; x1, x2 and target. Target takes two values 0 and 1 , depending on values taken by predictor variables x1 and x2. Let me plot this data for you.
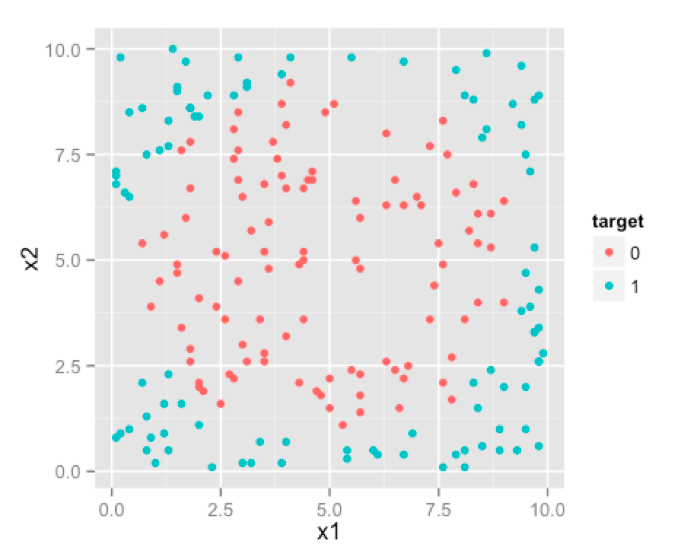
This right here is your feature space. where your observations lie. In this case , since we have only two predictors/features ,feature space is 2D. Here you can see two classes of your target marked by different colors. We would like our algorithm to give us a line/curve which can separate these two classes.
We can visually see , that an ideal decision boundary [or separating curve] would be circular. Shape of the produced decision boundary is where the difference lies between Logistic Regression , Decision Tress and SVM.
Lets start with logistic regression. Many of us are confused about shape of decision boundary given by a logistic regression. This confusion mainly arises because of looking at the famous S-shaped curve too many times in context of logistic regression.
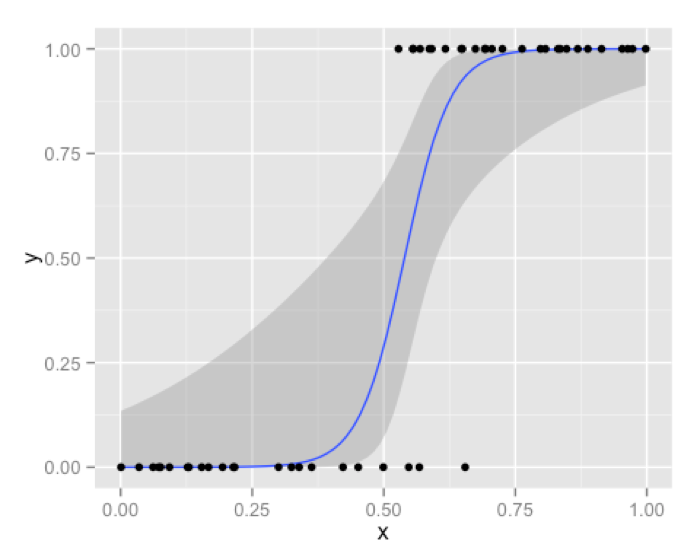
This blue curve that you see is not a decision boundary. Its simply in a way is transformed response from binary response which we model using logistic regression. Decision boundary of logistic regression is always a line [ or a plane , or a hyper-plane for higher dimension]. Best way to convince you will be , by showing the famous logistic regression equation that you are all too familiar with.

Let’s assume for simplification, F is nothing but a linear combination of all the predictors .
The above equation can also be written as :

Now to predict in logistic regression you decide a particular score cutoff for the probabilities, above which your prediction will be 1 or 0 otherwise. Lets say that cutoff is c. so your decision process will be like this :
Y=1 if p>c , otherwise 0. Which eventually gives the decision boundary F > constant.
F>constant, here is nothing but a linear decision boundary . Result of logistic regression for our sample data will be like this.
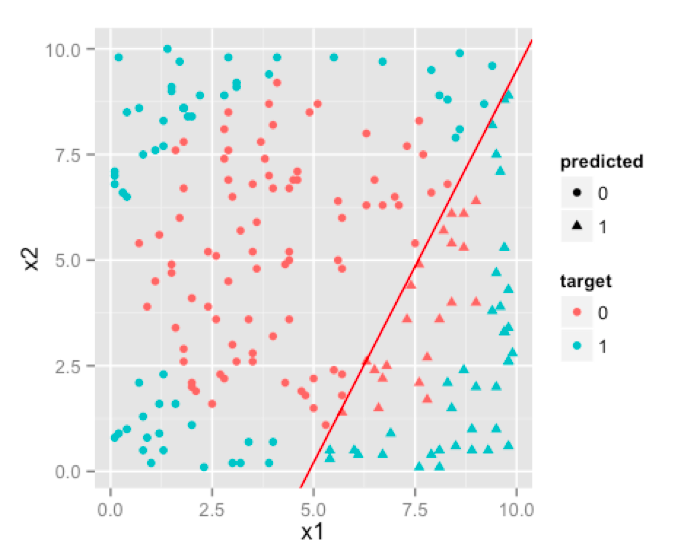
You can see that, it doesn’t do a very good job. Because whatever you do, decision boundary produced by logistic regression will always be linear , which can not emulate a circular decision boundary which is required. So, logistic regression will work for classification problems where classes are approximately linearly separable. [Although you can make classes linear separable in some cases through variable transformation, but we’ll leave that discussion for some other day].
Now lets see how decision trees handle these problems. We know that decision trees are made of hierarchical one variable rules . Such an example for our data is given below.
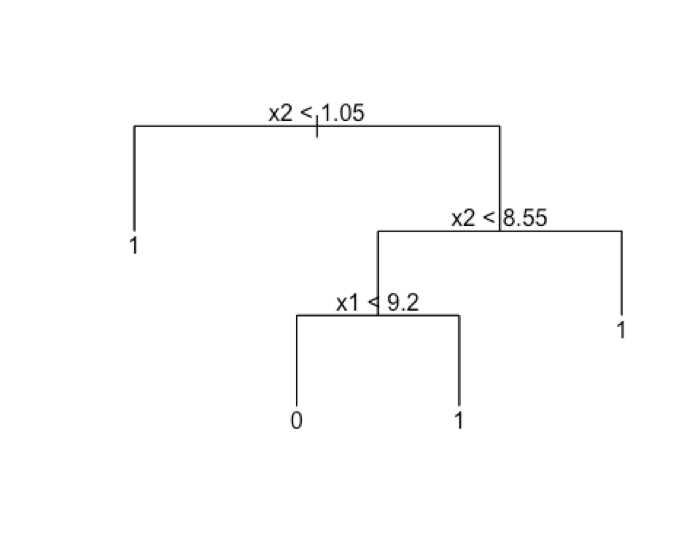
If you think carefully, these decision rules x2 |</>| const OR x1 |</>| const do nothing but partition the feature space with lines parallel to each feature axis like the diagram given below.
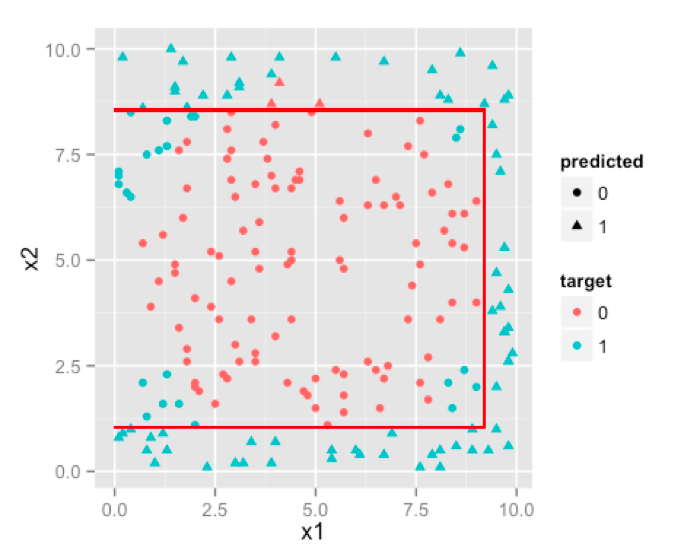
We can make our tree more complex by increasing its size , which will result in more and more partitions trying to emulate the circular boundary.
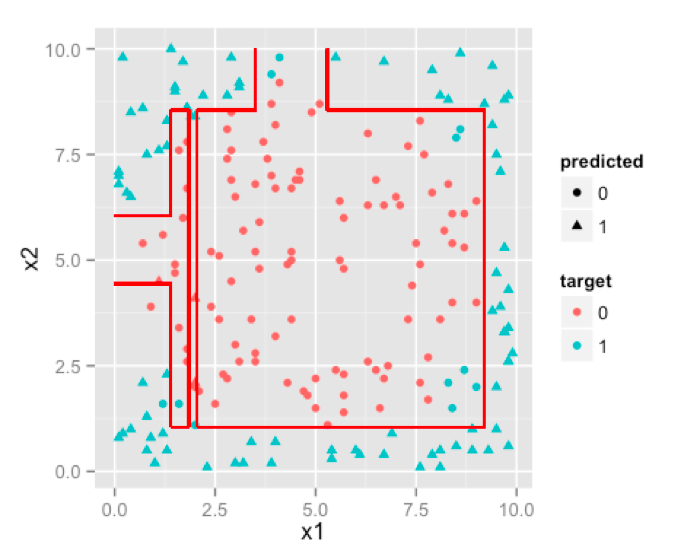
Ha! not a circle but it tried, that much credit is due. If you keep on increasing size of the tree , you’d notice that decision boundary will try to emulate circle as much as it can with parallel lines.So, if boundary is non-linear and can be approximated by cutting feature space into rectangles [ or cuboids or hyper-cuboid for higher dimensions ] then D-Trees are a better choice than logistic regression.
Next we’ll look at result of SVM. SVM works by projecting your feature space into kernel space and making the classes linearly separable. An easier explanation to that process would be that SVM adds an extra dimension to your feature space in a way that makes classes linearly separable. This planar decision boundary when projected back to original feature space emulates non linear decision boundary . Here this picture might explain better than me.
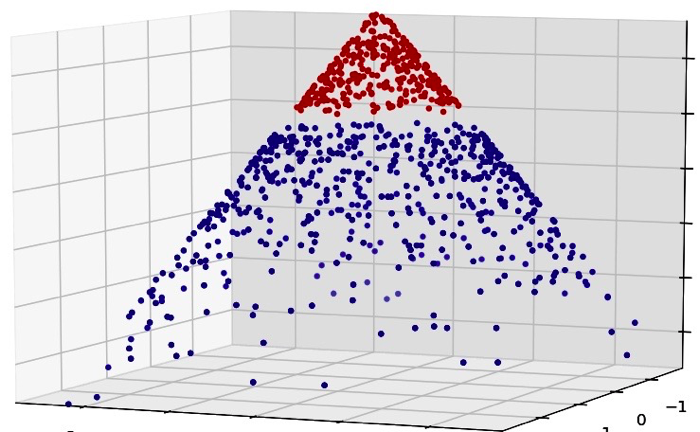
You can see that , once a third dimension in a special manner added to data , we can separate two classes with a plane [ a linear separator ], which once projected back onto the original 2-D feature space; becomes a circular boundary.
see how well SVM performs on our sample data:
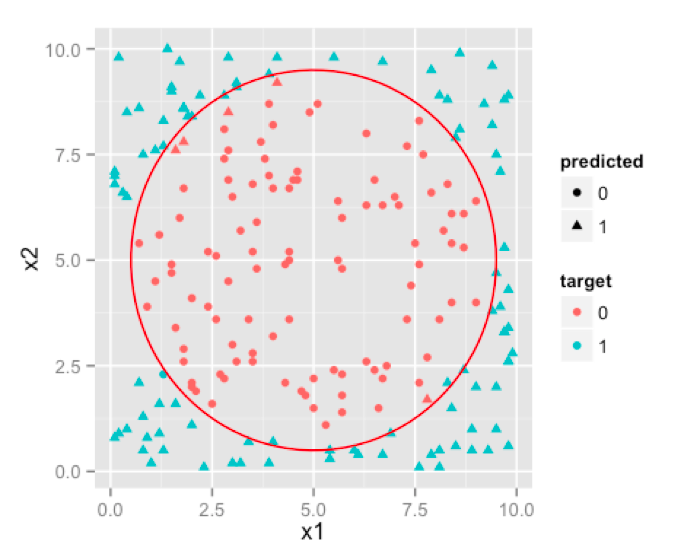
Note: The decision boundary will not be such a well rounded circle , but rather a very good approximation [a polygon] to it. We have used simple circle to avoid getting into hassle of drawing a tedious polygon in our software.
OK, so now the difference makes sense , but one question still remains. That is , when to choose which algorithm when dealing with multi dimensional data? This is a very important question because , you’ll not have such a convenient method of visualizing data when there are more than 3 predictors to be considered. We’ll discuss that in 2nd part of this post, stay tuned!
Logistic Regression Vs Decision Trees Vs SVM: Part I
原文:http://www.cnblogs.com/suanec/p/4992882.html