Windows OS 内置的Performance Monitor,在OS 底层对系统的Performance进行监控,可以实时检查运行程序影响计算机性能的方式(CPU,ROM,IO等),并通过收集日志数据供离线分析使用。
You can use Windows Performance Monitor to examine how programs you run affect your computer‘s performance, both in real time and by collecting log data for later analysis.
Windows Performance Monitor uses performance counters, event trace data, and configuration information, which can be combined into Data Collector Sets.
Performance counters are measurements of system state or activity. They can be included in the operating system or can be part of individual applications. Windows Performance Monitor requests the current value of performance counters at specified time intervals.
Event trace data is collected from trace providers, which are components of the operating system or of individual applications that report actions or events. Output from multiple trace providers can be combined into a trace session .
Configuration information is collected from key values in the Windows registry. Windows Performance Monitor can record the value of a registry key at a specified time or interval as part of a log file.
Windows Performance Monitor performs data collection and logging using Data Collector Sets.
1,打开 Performance Monitor
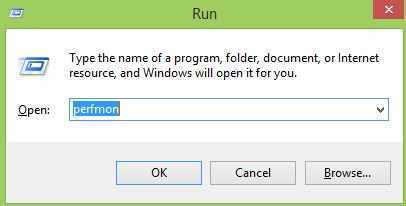
点击Windows+R,在Run中输入perfmon
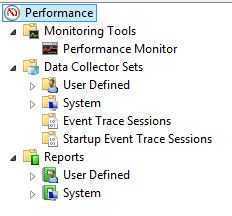
2,进入Performance Monitor UI
Monitoring Tools 中有Performance Monitor,Data Collector Sets 和 Reports。
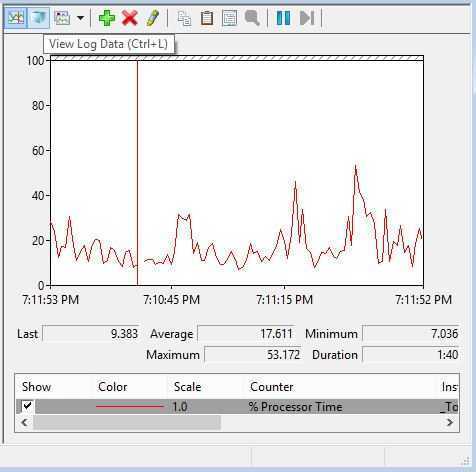
3,查看Performance Monitor Pane
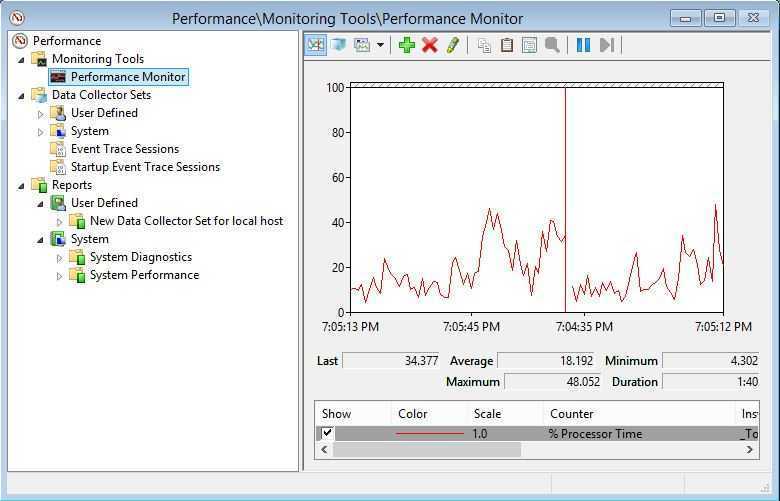
4,Right Pane的menu bar
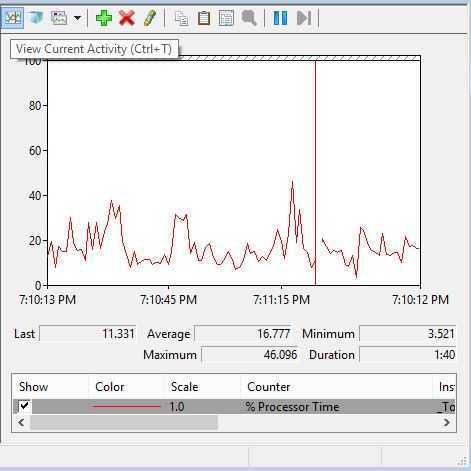
4.1 Viewing performance data, both in real time and from log files
前两个menu 表示 Data Source,分别是View Current Activity 和 View Log Data,提供了real-time monitor 和 data collection的能力。
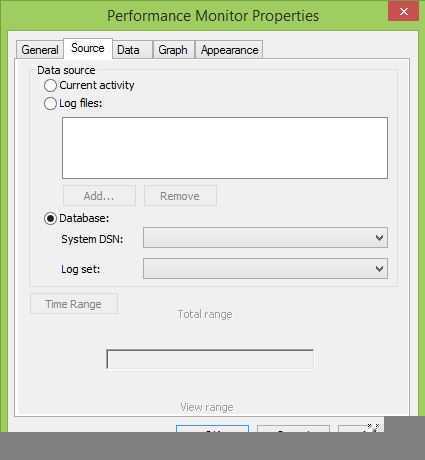
点击View Log Data,需要设置Performance Monitor的Source Properties,记录Log的方式有两种:file 和 Database。
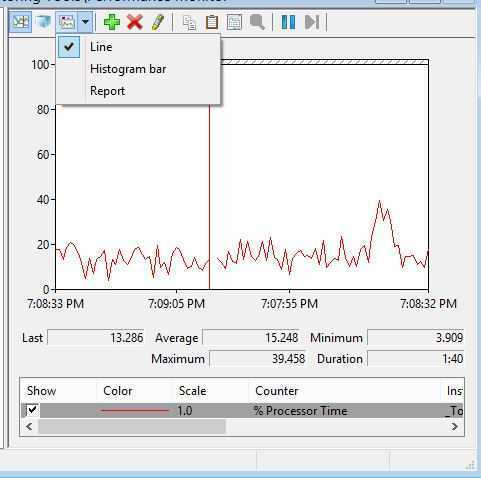
4.2 Data Display
第三个Menu 是数据的显示格式,分别是Line,Histogram bar, 和Report
Report 是文本方式显示计数器的数值。
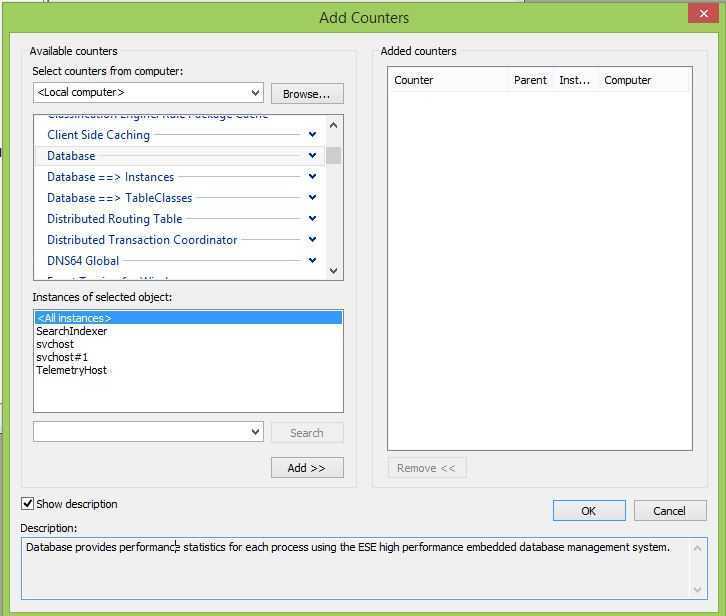
4.3 Edit Performance Counter
“+” 和 “X” 是增加和删除 Performance Counter,添加Performance Counter 进行性能数据收集。
Performance counters are measurements of system state or activity.
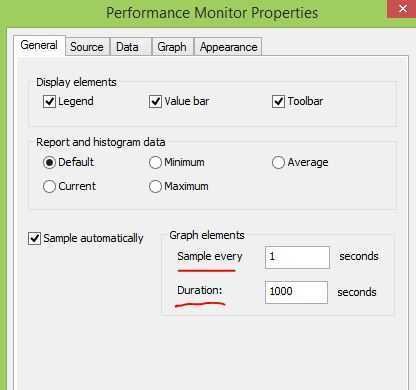
5,Sample Interval
Performance Counter 测试系统性能或活动的取样时间间隔是由属性 Sample Interval确定的。
在Performance Monitor Properties 的 General tab中,
勾选 Sample automatically,
Sample Every X seconds: 采样的时间间隔
Duration X seconds: 是指Graph 显示的时间长度,这是 Real-Time Monitor 模式下数据保持的最长时间。
参考文档:
MSDN:https://technet.microsoft.com/en-us/library/cc749249.aspx
Performance Monitoring Getting Started Guide
http://www.cnblogs.com/nzperfect/archive/2009/07/26/1531512.html
Performance Monitor usage1:Overview
原文:http://www.cnblogs.com/ljhdo/p/5061561.html