今天要看的是霍夫变换,常用用来检测直线和圆,这里是把常见的笛卡尔坐标系转换成极坐标下,进行累计峰值的极大值,确定。HoughLines,HoughLinesP,HoughCircles,三个函数,首先先看看原理,最后会用漂亮的matlab图,来回归一下,霍夫直线变换。
众所周知, 一条直线在图像二维空间可由两个变量表示. 例如:
 斜率和截距表示.
 极径和极角表示
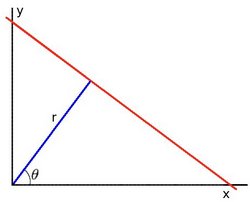
对于霍夫变换, 我们将用 极坐标系 来表示直线. 因此, 直线的表达式可为:
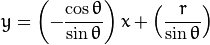
化简得: 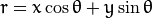
一般来说对于点  ,
我们可以将通过这个点的一族直线统一定义为:
,
我们可以将通过这个点的一族直线统一定义为:

这就意味着每一对  代表一条通过点 的直线.
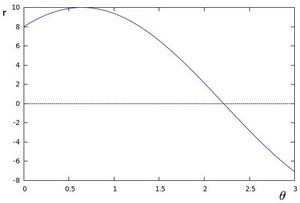
如果对于一个给定点 我们在极坐标对极径极角平面绘出所有通过它的直线,
将得到一条正弦曲线. 例如, 对于给定点  and
and  我们可以绘出下图
(在平面
我们可以绘出下图
(在平面  -
-  ):
):
只绘出满足下列条件的点  and
and  .
.
我们可以对图像中所有的点进行上述操作. 如果两个不同点进行上述操作后得到的曲线在平面 - 相交,
这就意味着它们通过同一条直线. 例如, 接上面的例子我们继续对点:  ,
,  和点
和点  ,
,  绘图,
得到下图:
绘图,
得到下图:
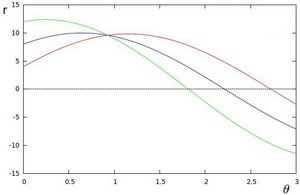
这三条曲线在 - 平面相交于点  ,
坐标表示的是参数对 (
,
坐标表示的是参数对 ( ) 或者是说点 ,
点
) 或者是说点 ,
点  和点
和点  组成的平面内的的直线.
- 原理在上面的部分已经说明了. 它能给我们提供一组参数对
的集合来表示检测到的直线
- 在OpenCV 中通过函数 HoughLines 来实现
- 这是执行起来效率更高的霍夫线变换. 它输出检测到的直线的端点
- 在OpenCV 中它通过函数 HoughLinesP 来实现
<span style="font-size:18px;">C++: void HoughLines(InputArray image, OutputArray lines, double rho, double theta, int threshold, double srn=0, double stn=0 ) </span>
<span style="font-size:18px;">C++: void HoughLinesP(InputArray image, OutputArray lines, double rho, double theta, int threshold, double minLineLength=0, double maxLineGap=0 )
</span>
<span style="font-size:18px;">#include "opencv2/highgui/highgui.hpp"
#include "opencv2/imgproc/imgproc.hpp"
#include <iostream>
using namespace cv;
using namespace std;
int main(int argc, char** argv)
{
    const char* filename = argc >= 2 ? argv[1] : "lena.jpg";
    Mat src = imread(filename, 0);
    if(src.empty())
    {
        help();
        cout << "can not open " << filename << endl;
        return -1;
    }

    Mat dst, cdst;
    Canny(src, dst, 50, 200, 3);
    cvtColor(dst, cdst, CV_GRAY2BGR);
#if 0
    vector<Vec2f> lines;
    HoughLines(dst, lines, 1, CV_PI/180, 100, 0, 0 );
    for( size_t i = 0; i < lines.size(); i++ )
    {
        float rho = lines[i][0], theta = lines[i][1];
        Point pt1, pt2;
        double a = cos(theta), b = sin(theta);
        double x0 = a*rho, y0 = b*rho;
        pt1.x = cvRound(x0 + 1000*(-b));
        pt1.y = cvRound(y0 + 1000*(a));
        pt2.x = cvRound(x0 - 1000*(-b));
        pt2.y = cvRound(y0 - 1000*(a));
        line( cdst, pt1, pt2, Scalar(0,0,255), 3, CV_AA);
    }
#else
    vector<Vec4i> lines;
    HoughLinesP(dst, lines, 1, CV_PI/180, 50, 50, 10 );
    for( size_t i = 0; i < lines.size(); i++ )
    {
        Vec4i l = lines[i];
        line( cdst, Point(l[0], l[1]), Point(l[2], l[3]), Scalar(0,0,255), 3, CV_AA);
    }
#endif
    imshow("source", src);
    imshow("detected lines", cdst);

    waitKey();

    return 0;
}  </span>
<span style="font-size:18px;">

#include <opencv2/opencv.hpp>
#include <opencv2/highgui/highgui.hpp>
#include <opencv2/imgproc/imgproc.hpp>
using namespace std;
using namespace cv;
Mat g_srcImage, g_dstImage,g_midImage;
vector<Vec4i> g_lines;
int g_nthreshold=100;
static void on_HoughLines(int, void*);
int main( )
{
    Mat g_srcImage = imread("lena.jpg");
    imshow("【原始图】", g_srcImage);
    namedWindow("【效果图】",1);
    createTrackbar("值", "【效果图】",&g_nthreshold,200,on_HoughLines);
    Canny(g_srcImage, g_midImage, 50, 200, 3);
    cvtColor(g_midImage,g_dstImage, CV_GRAY2BGR);
    on_HoughLines(g_nthreshold,0);
    HoughLinesP(g_midImage, g_lines, 1, CV_PI/180, 80, 50, 10 );
    imshow("【效果图】", g_dstImage);
    waitKey(0);
    return 0;

}

static void on_HoughLines(int, void*)
{

     Mat dstImage=g_dstImage.clone();
     Mat midImage=g_midImage.clone();
     vector<Vec4i> mylines;
    HoughLinesP(midImage, mylines, 1, CV_PI/180, g_nthreshold+1, 50, 10 );

    for( size_t i = 0; i < mylines.size(); i++ )
    {
        Vec4i l = mylines[i];
        line( dstImage, Point(l[0], l[1]), Point(l[2], l[3]), Scalar(23,180,55), 1, CV_AA);
    }

    imshow("【效果图】",dstImage);
}

</span>
霍夫圆变换的基本原理和上面讲的霍夫线变化大体上是很类似的,只是点对应的二维极径极角空间被三维的圆心点x, y还有半径r空间取代
<span style="font-size:18px;">C++: void HoughCircles(InputArray image,OutputArray circles, int method, double dp, double minDist, double param1=100,double param2=100, int minRadius=0, int maxRadius=0 )
</span>
过点(x1,y1)的所有圆可以表示为(a1(i),b1(i),r1(i)),过点(x2,y2)的所有圆可以表示为(a2(i),b2(i),r2(i)),过点(x3,y3)的所有圆可以表示为(a3(i),b3(i),r3(i)),如果这三个点在同一个圆上,那么存在一个值(a0,b0,r0),使得 a0 = a1(k)=a2(k)=a3(k) 且b0 = b1(k)=b2(k)=b3(k) 且r0 = r1(k)=r2(k)=r3(k),即这三个点同时在圆(a0,b0,r0)上。
从下图可以形象的看出:

<span style="font-size:18px;">#include <opencv2/opencv.hpp>
#include <opencv2/imgproc/imgproc.hpp>
using namespace cv;
int main( )
{
    Mat srcImage = imread("1.png");
    Mat midImage,dstImage;
    imshow("【原始图】", srcImage);
    cvtColor(srcImage,midImage, CV_BGR2GRAY);
    GaussianBlur( midImage, midImage, Size(9, 9), 2, 2 );
    vector<Vec3f> circles;
    HoughCircles( midImage, circles, CV_HOUGH_GRADIENT,1.5, 10, 200, 100, 0, 0 );
    for( size_t i = 0; i < circles.size(); i++ )
    {
        Point center(cvRound(circles[i][0]), cvRound(circles[i][1]));
        int radius = cvRound(circles[i][2]);
        circle( srcImage, center, 3, Scalar(0,255,0), -1, 8, 0 );
        circle( srcImage, center, radius, Scalar(155,50,255), 3, 8, 0 );
    }

    imshow("【效果图】", srcImage);
    waitKey(0);
    return 0;
}  </span>
matlab
<span style="font-size:18px;">I  = imread('circuit.tif');
rotI = imrotate(I,33,'crop');
figure
imshow(rotI, [])
BW = edge(rotI,'canny');
[H,T,R] = hough(BW,'RhoResolution',0.5,'ThetaResolution',0.5);
figure
imshow(H,[],'XData',T,'YData',R,...
            'InitialMagnification','fit');
xlabel('theta'), ylabel('rho');
axis on, axis normal, hold on;
colormap(hot)
P  = houghpeaks(H,5,'threshold',ceil(0.3*max(H(:))));
x = T(P(:,2)); y = R(P(:,1));
plot(x,y,'s','color','white');
% Find lines and plot them
lines = houghlines(BW,T,R,P,'FillGap',5,'MinLength',7);
figure, imshow(rotI), hold on
max_len = 0;
for  k = 1:length(lines)
   xy = [lines(k).point1; lines(k).point2];
   plot(xy(:,1),xy(:,2),'LineWidth',2,'Color','green');

   % Plot beginnings and ends of lines
   plot(xy(1,1),xy(1,2),'x','LineWidth',2,'Color','yellow');
   plot(xy(2,1),xy(2,2),'x','LineWidth',2,'Color','red');

   % Determine the endpoints of the longest line segment
   len = norm(lines(k).point1 - lines(k).point2);
   if ( len > max_len)
      max_len = len;
      xy_long = xy;
   end
end

% highlight the longest line segment
plot(xy_long(:,1),xy_long(:,2),'LineWidth',2,'Color','blue');</span>
左边图是hough变换,右边是标记直线结果
Opencv图像识别从零到精通(22)-----hough变换检测直线与圆
原文:http://blog.csdn.net/qq_20823641/article/details/52129767
