The Element Inspector in Chrome DevTools offers powerful integration with the console - learn how to programmatically navigate your selected element, how to search through the history and use CSS selectors to control what you‘re looking at and how to quickly and easily listen for events as you debug your application.
$1, $2, $3, $4: refer to previous element.
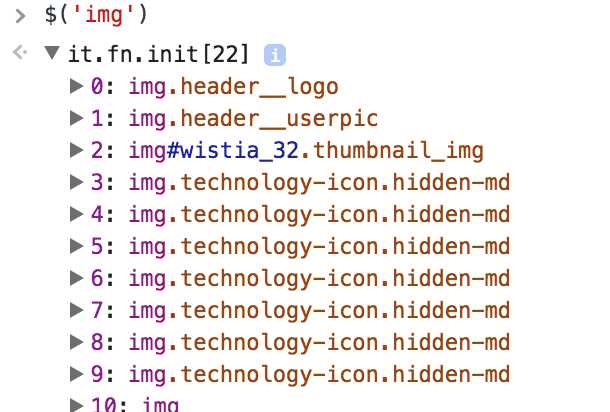
We can use jQuery even not include the lib:
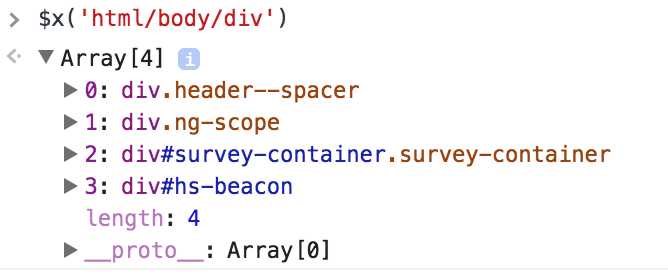
We can use xPath to get the elements:
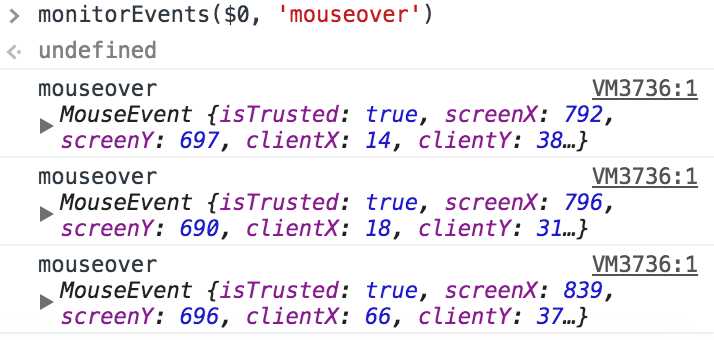
We can monitor events:
[Debug] Chrome Devtools: Elements - Console Integration
原文:http://www.cnblogs.com/Answer1215/p/5995286.html