上代码:
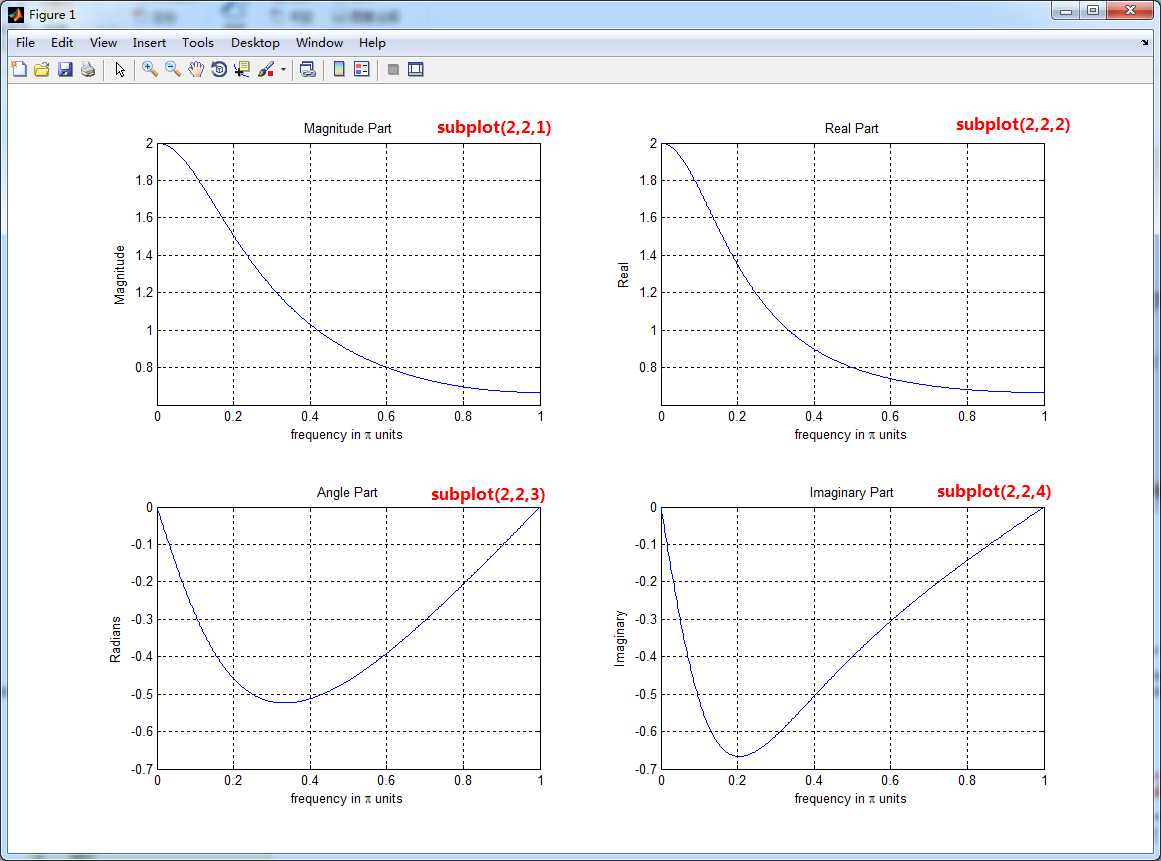
w = [0:1:500]*pi/500;    % [0,pi] axis divided into 501 points.
X = exp(j*w) ./ (exp(j*w) - 0.5*ones(1,501));

magX = abs(X); angX = angle(X); realX = real(X); imagX = imag(X);

set(gcf,‘Color‘,‘white‘);
subplot(2,2,1); plot(w/pi,magX); grid on;
title(‘Magnitude Part‘);
xlabel(‘frequency in \pi units‘); ylabel(‘Magnitude‘);
subplot(2,2,3); plot(w/pi, angX); grid on;
title(‘Angle Part‘);
xlabel(‘frequency in \pi units‘); ylabel(‘Radians‘);
subplot(‘2,2,2‘); plot(w/pi, realX); grid on;
title(‘Real Part‘);
xlabel(‘frequency in \pi units‘); ylabel(‘Real‘);
subplot(‘2,2,4‘); plot(w/pi, imagX); grid on;
title(‘Imaginary Part‘);
xlabel(‘frequency in \pi units‘); ylabel(‘Imaginary‘);
运行结果:
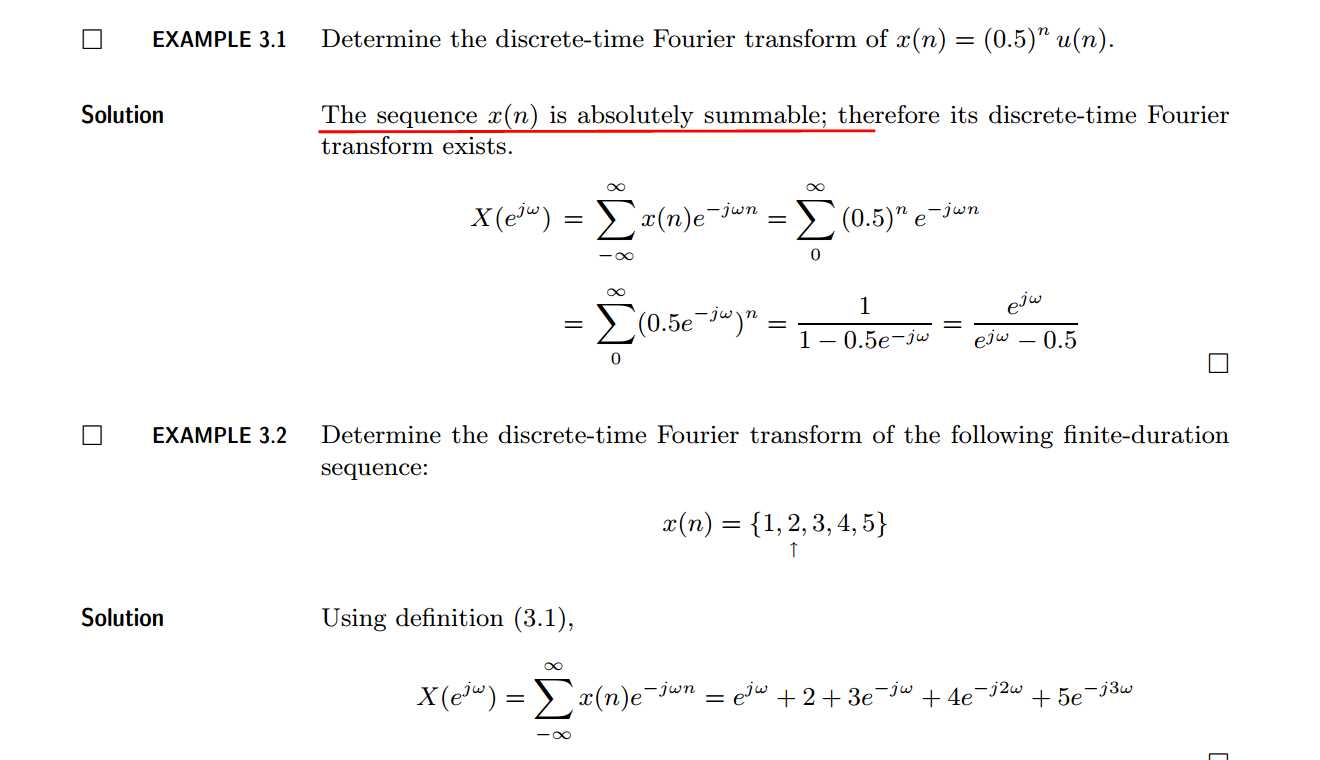
DSP using MATLAB 示例Example3.1 3.2 3.3
原文:http://www.cnblogs.com/ky027wh-sx/p/6041381.html