Introduce:
Process Explorer is an advanced process management utility that picks up where Task Manager leaves off. It will show you detailed information about a process including its icon, command-line, full image path, memory statistics, user account, security attributes, and more. When you zoom in on a particular process you can list the DLLs it has loaded or the operating system resource handles it has open. A search capability enables you to track down a process that has a resource opened, such as a file, directory or Registry key, or to view the list of processes that have a DLL loaded.
Download:
http://download.sysinternals.com/files/ProcessExplorer.zip
Test:
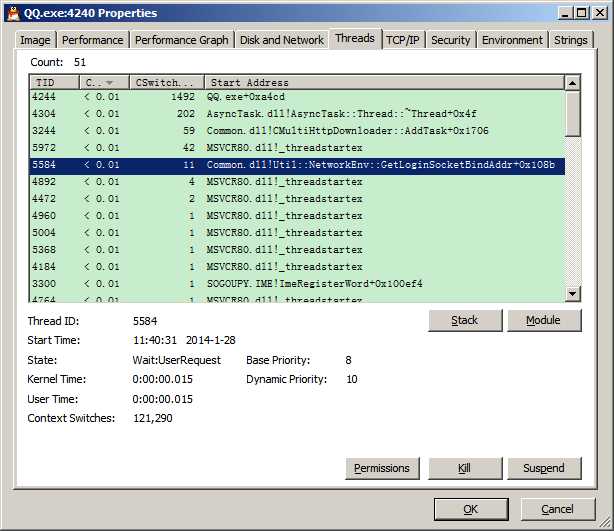
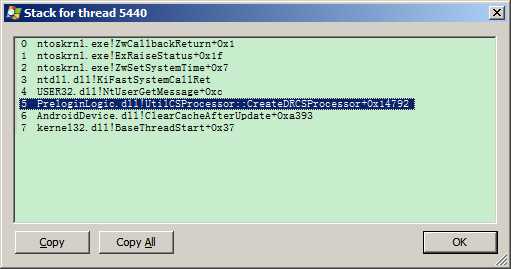
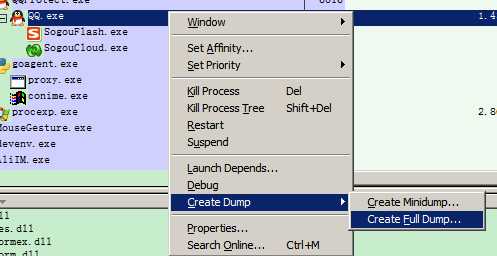
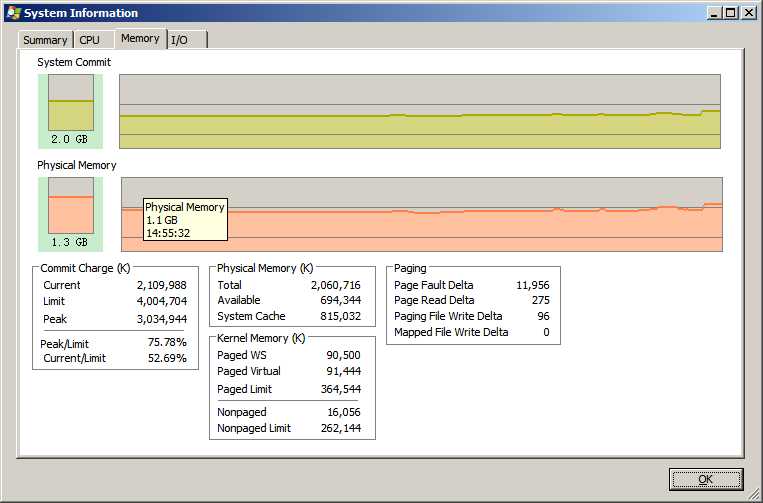
Summery: Process Explorer is very powerfull tool. Easy use, useful for debug & analyze.
原文:http://www.cnblogs.com/iclk/p/3535723.html