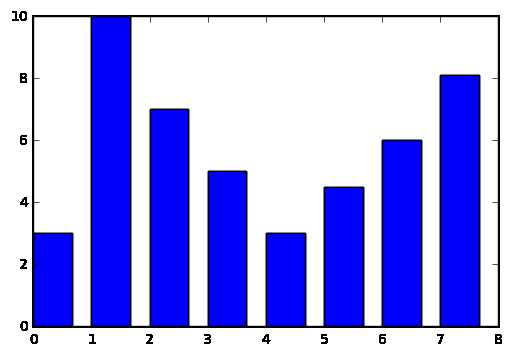
import matplotlib.pyplot as plt

import plotly.plotly as py
# Learn about API authentication here: https://plot.ly/python/getting-started
# Find your api_key here: https://plot.ly/settings/api

y = [3, 10, 7, 5, 3, 4.5, 6, 8.1]
N = len(y)
x = range(N)
width = 1/1.5
plt.bar(x, y, width, color="blue")

fig = plt.gcf()
#plot_url = py.plot_mpl(fig, filename=‘mpl-basic-bar‘)
plt.show()
原文:http://www.cnblogs.com/casperwin/p/6181808.html