EG1
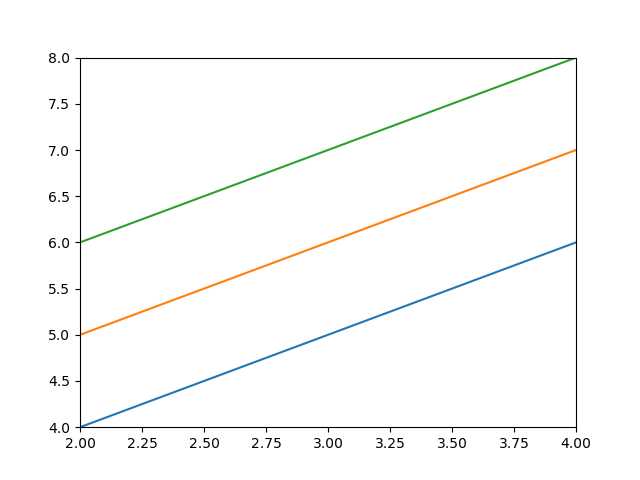
import numpy as np
import matplotlib.pyplot as plt

y = np.arange(1, 5)
plt.plot(y, y + 2, label=‘Normal‘)
plt.plot(y, y + 3, label=‘Fast‘)
plt.plot(y, y + 4, label=‘Faster‘)

print(plt.axis()) #(0.84999999999999998, 4.1500000000000004, 2.75, 8.25)
plt.xlim([2,4])
plt.ylim([4,8])
plt.axis([2,4,4,8]) # xmin, xmax, ymin, ymax
plt.show()
原文:http://www.cnblogs.com/zsr0401/p/6427850.html