
___________________________________________________________________

The information contained in this document is provided for informational purposes only and represents the current view of Intel Corporation ("Intel") and its contributors ("Contributors") on, as of the date of publication. Intel and the Contributors make no commitment to update the information contained in this document, and Intel reserves the right to make changes at any time, without notice.
DISCLAIMER. THIS DOCUMENT, IS PROVIDED "AS IS." NEITHER INTEL, NOR THE
CONTRIBUTORS MAKE ANY REPRESENTATIONS OF ANY KIND WITH RESPECT TO PRODUCTS
REFERENCED HEREIN, WHETHER SUCH PRODUCTS ARE THOSE OF INTEL, THE CONTRIBUTORS,
OR THIRD PARTIES. INTEL, AND ITS CONTRIBUTORS EXPRESSLY DISCLAIM ANY AND ALL
WARRANTIES, IMPLIED OR EXPRESS, INCLUDING WITHOUT LIMITATION, ANY WARRANTIES OF
MERCHANTABILITY, FITNESS FOR ANY PARTICULAR PURPOSE, NON-INFRINGEMENT, AND ANY
WARRANTY ARISING OUT OF THE INFORMATION CONTAINED HEREIN, INCLUDING WITHOUT
LIMITATION, ANY PRODUCTS, SPECIFICATIONS, OR OTHER MATERIALS REFERENCED HEREIN.
INTEL, AND ITS CONTRIBUTORS DO NOT WARRANT THAT THIS DOCUMENT IS FREE FROM
ERRORS, OR THAT ANY PRODUCTS OR OTHER TECHNOLOGY DEVELOPED IN CONFORMANCE WITH
THIS DOCUMENT WILL PERFORM IN THE INTENDED MANNER, OR WILL BE FREE FROM
INFRINGEMENT OF THIRD PARTY PROPRIETARY RIGHTS, AND INTEL, AND ITS CONTRIBUTORS
DISCLAIM ALL LIABILITY THEREFOR. INTEL, AND ITS CONTRIBUTORS DO NOT WARRANT THAT
ANY PRODUCT REFERENCED HEREIN OR ANY PRODUCT OR TECHNOLOGY DEVELOPED IN RELIANCE
UPON THIS DOCUMENT, IN WHOLE OR IN PART, WILL BE SUFFICIENT, ACCURATE, RELIABLE,
COMPLETE, FREE FROM DEFECTS OR SAFE FOR ITS INTENDED PURPOSE, AND HEREBY
DISCLAIM ALL LIABILITIES THEREFOR. ANY PERSON MAKING, USING OR SELLING SUCH
PRODUCT OR TECHNOLOGY DOES SO AT HIS OR HER OWN RISK.
Licenses may be
required. Intel, its contributors and others may have patents or pending patent
applications, trademarks, copyrights or other intellectual proprietary rights
covering subject matter contained or described in this document. No license,
express, implied, by estoppels or otherwise, to any intellectual property rights
of Intel or any other party is granted herein. It is your responsibility to seek
licenses for such intellectual property rights from Intel and others where
appropriate. Limited License Grant. Intel hereby grants you a limited copyright
license to copy this document for your use and internal distribution only. You
may not distribute this document externally, in whole or in part, to any other
person or entity. LIMITED LIABILITY. IN NO EVENT SHALL INTEL, OR ITS
CONTRIBUTORS HAVE ANY LIABILITY TO YOU OR TO ANY OTHER THIRD PARTY, FOR ANY LOST
PROFITS, LOST DATA, LOSS OF USE OR COSTS OF PROCUREMENT OF SUBSTITUTE GOODS OR
SERVICES, OR FOR ANY DIRECT, INDIRECT, SPECIAL OR CONSEQUENTIAL DAMAGES ARISING
OUT OF YOUR USE OF THIS DOCUMENT OR RELIANCE UPON THE INFORMATION CONTAINED
HEREIN, UNDER ANY CAUSE OF ACTION OR THEORY OF LIABILITY, AND IRRESPECTIVE OF
WHETHER INTEL, OR ANY CONTRIBUTOR HAS ADVANCE NOTICE OF THE POSSIBILITY OF SUCH
DAMAGES. THESE LIMITATIONS SHALL APPLY NOTWITHSTANDING THE FAILURE OF THE
ESSENTIAL PURPOSE OF ANY LIMITED REMEDY.
Intel and Intel logo are trademarks or registered trademarks of Intel Corporation or its subsidiaries in the United States and other countries.
*Other names and brands may be claimed as the property of others.
Copyright ? 2010, Intel Corporation. All Rights Reserved.Table of Contents
Disclaimer iii
Static Security Analysis 1
Activity 1 - Setting up SSA using Microsoft Visual Studio 1
Activity 2 - Running and Managing SSA results 3
Activity 3 - Investigating a problem 5
|
Time Required |
Ten minutes |
|
Objective |
|
We will go through the setup process using Microsoft Visual Studio* solution tachyon.sln that is supplied with the sample program. You should find this under <Parallel Inspector XE>\samples\windows\tachyon_ssa directory. Start by opening this solution in Visual Studio*. If you are using Visual Studio 2008* or Visual Studio 2010* then Visual Studio* will need to convert the solution file from Visual Studio 2005 format. Let it go ahead and do this conversion for you.
Create a new build configuration as follows:
Before you can set the options on your new build configuration, you need to set the project to build with the Intel compiler. Do that as follows:
Now you are ready to set the properties for SSA.
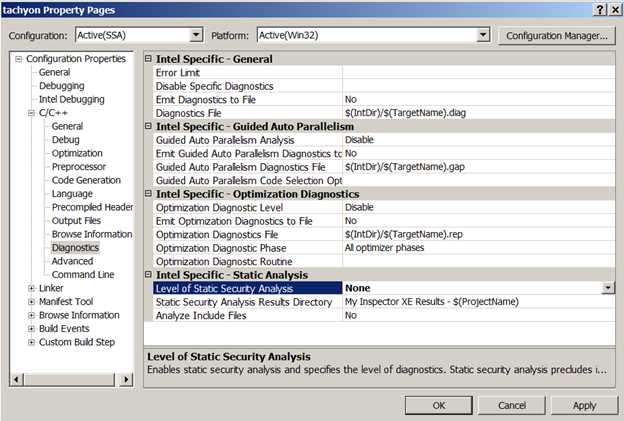
That‘s it; you are now set up for SSA!
|
Time Required |
Ten minutes |
|
Objective |
|
Now that you are set up, all you have to do is build your SSA build configuration to perform analysis. You can do this by right-clicking on the tachyon project in the solution explorer and choosing Build.
Inspector XE automatically opens a new result as soon as the build completes.
The initial window you will see will look something like this. (Note: you might have to drag the scrollbar up to the top to get the right line on top.)
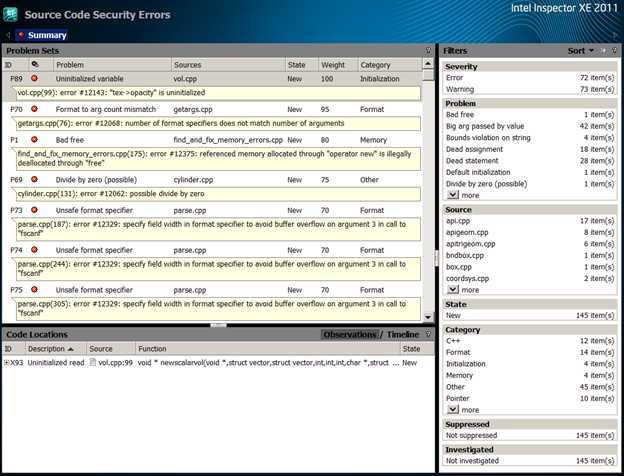
This window consists of three main areas. The upper left pane is the table of Problem Sets. This is your "to do" list, the things you need to investigate. The lower left pane shows the code locations corresponding to the currently selected problem set. The right pane shows the filters. It controls what problem sets are displayed and which are hidden.
You can sort the table of problem sets by clicking on any of the column headers. By default the problem set table is sorted by "weight". The weight is a value between 1 and 100 which reflects how interesting a problem is. Problems that can do more damage have higher weight. Problems that are more likely to be true problems (as opposed to false positives) are also given higher weight. So the weight provides a natural guidance for your order of investigation.
|
Time Required |
Ten minutes |
|
Objective |
|
Let‘s start with an easy one. P73, the fourth one on the list, is an unsafe format specifier. Let‘s see what we can learn about this problem.
So far all we know about the problem is summarized in the table entry:
Here Unsafe format specifier is the short description of the problem. The full description is shown in the shaded area. The New entry in the state column indicates that this problem was discovered for the first time in this analysis run and has not yet been investigated. The 70 weight value indicates the weight. The category of problem is Format, which means it is related to misuse for printf style format specifications.
Click on this problem to select it. The lower pane refreshes itself to show the source code locations related to this problem. Here‘s what it says:

Here we see the source location (file parse.cpp, line 187). We also see the role that this source reference plays in the problem. Format mismatch indicates that this is a place where a format string was used. It also shows the name of the function that contains the line (GetString) and its parameter signature.
One way we could get more information about a problem is to read an explanation of what that problem type means. Some SSA errors are pretty technical and require explanation. To see the explanation for this problem type, right click on the problem. That brings up this pop-up menu:
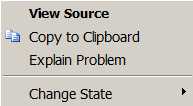
Select Explain Problem. This brings up a help topic that explains this problem in detail. Here‘s what the help topic looks like for this particular problem type:
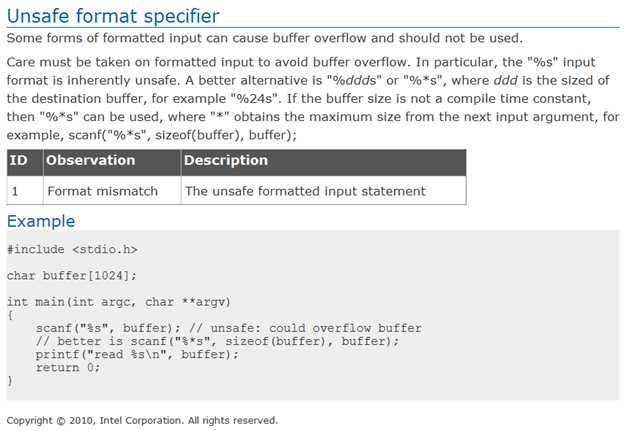
As you can see, the problem type reference material explains more fully what the precise error condition is and its potential consequences. It explains more fully the role the various code locations play in creating the problem, and provides an example that demonstrates the problem.
The next thing we need to do is determine whether this problem is really present in our application. To do that, we need to look at the source code. The fastest way to do that is to expand the code reference in the lower pane to expose a small snippet at the referenced location. There are two ways to do this. One is to click the + sign in the ID column. The other is to right-click on the item in the lower pane and select Expand All Code Snippets from the pop-up menu. After you do this, you will see this:

This is pretty clear. The highlighted call to fscanf has a format string with a %s format specifier. This reads input characters up to the next newline and stores the data in the array data. There is no guarantee that the number of characters read will not overflow the bounds of the array, so this statement could corrupt memory. We got lucky here, because the code snippet contained all we needed to know about this problem. We will see later how we see more of the source when we need to.
Since we have confirmed that this is a real error, let‘s record our conclusion. Right click on the problem and select Change State > Confirmed from the pop-up menu.
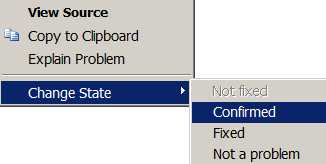
Now we‘re done with that problem. You can see the state is updated in the problem set table:

Reducing clutter with Filtering
Filters allow you to focus on the problems you are interested in and hide the problems you want to ignore.
Once a problem has been investigated there is usually no reason to look at it again. One of the nicest uses for filters to hide all the problems you are finished investigating. Go all the way to the bottom of the filter window and click on the Not investigated item inside the Investigated filter.

When you do that, the filter item redraws to indicate that it is active:

Notice how that problem we marked as Confirmed disappeared from the table of problem sets when we did that. It is a good idea to keep this filter set like this while you work on analyzing results.
The first several filters - Severity, Problem, Source, State and Category correspond to columns in the table of problem sets. You can hide all rows in the table that do not match a specific value in some column. Click on the second line in the Source filter (apigeom.cpp). It will look like this:

Notice how the problem set table has also redrawn to show only problems in this source file. You can always turn off a filter by clicking on the All box, but leave it turned on for now.
Let‘s take a look at another problem in the solution. This time let‘s pick problem P94, which should be the second one you now see in the table of problem sets:

This problem is a little more interesting. As you can see, it has two source locations in different files. The problem type is Null pointer dereference (possible). The full description describes two places where a pointer is dereferenced that could possibly be set to null. In both cases the place where the pointer was possibly set to null is the same (apigeom.cpp, line 143).
This illustrates why we call this the table of problem sets instead of problems. Here SSA has combined two related problems into one problem set because it is likely that both problems could have a common solution.
Let‘s investigate to see what is happening here. As before, let‘s select this problem set and look at the lower pane to see the related source code. Here‘s what you will see:

Here we see three code locations. One is the place where the pointer was assigned (Memory write) and the other two places are where a null pointer value could be dereferenced. Let‘s take a closer look by right-clicking on one of these and selecting Expand All Code Snippets from the pop-up menu.
Here‘s what we see:
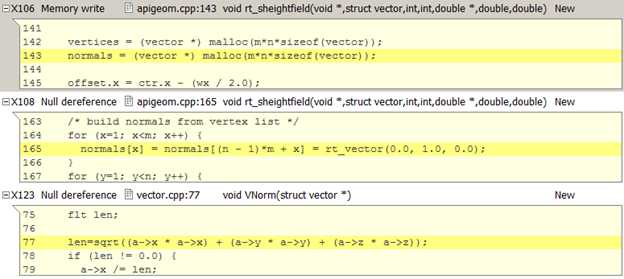
Now the problem is starting to become apparent. The memory write assigned a value from the routine malloc. malloc returns a null pointer when an application runs out of memory. Apparently this application didn‘t check for that case before using the pointer. Looking at the second snippet it seems pretty clear that this is what‘s happening: we‘re using what looks like the same pointer variable here (normals), 20 lines below the assignment in the same file and subroutine. But what‘s going on in that third snippet? We can see this is using a pointer (a), but what‘s that got to do with the normals pointer variable? And this is a completely different source file (vector.cpp). How is that related to that malloc call?
Here you must remember that SSA is doing whole-program, cross file analysis. It can analyze the flow of data values through procedure calls, even across files. But how did the value that was received from malloc get into the pointer named a?
SSA helps you answer questions like this by providing Traceback information. To see the Traceback information, you have to go over to the Sources view. Right-click on one of these code references and select View Source from the pop-up menu. This is what you will see:
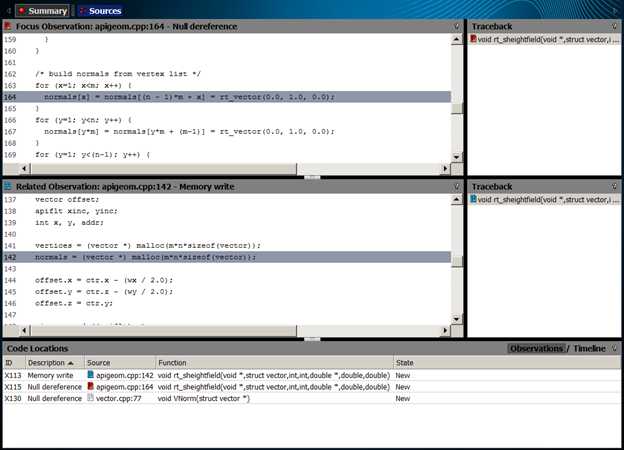
This is the Sources view. It contains two pairs of windows, each of which is showing a section of source code and (on the right) a Traceback. Up at the top left you see a highlighted box that says Sources. To the left of that you see another box that says Summary. If you click on that it brings you back to the summary view we were looking at earlier.
Neither of these code windows shows the source location we‘re interested in. However, down at the bottom is the same table of code locations we saw in the summary view. If you look closely you will see a little red tag on one and a blue tag on another. This tells you which code locations are on display. The same red and blue tags are shown in the upper left in the code window.
The bottom code location is the one we‘re after, the one in vector.cpp. Double click on it. Now that source for that code reference appears. You could also right click on it and choose Set as Related Observation or Set as Focus Observation from the pop-up menu. The red tag is for the focus observation and the blue tag is for the related observation. Here‘s what you see:
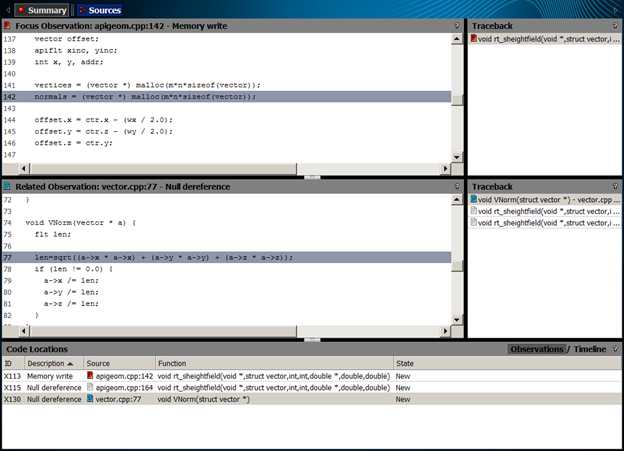
Look to the right of the middle pane, at the windows that says Traceback on it. This contains three lines. Go ahead and click on these lines one after another. You can see the left code window refresh itself with different source positions. The one on the end of the Traceback is in fact the same source location you see in the top screen, the place where malloc was called.
The Traceback is showing you the connections between where you started (malloc) and where you ended up (the possibly null dereference of a). The interesting place is the middle point in the Traceback. Let‘s take a closer look at that one:

Here we see a call to MyVNorm. If you look back at the place where the dereference happened, you will see that it is in a subroutine called VNorm. Don‘t be confused by the fact that MyVNorm and VNorm don‘t look like the same thing: they are. Here‘s the line in the apigeom.cpp that proves it:
#define MyVNorm(a) VNorm ((vector *) a)
This call ties the two things together. We started in the routine called rt_sheightfield, we malloc-ed some storage and assigned it to a pointer called normals. Then we called VNorm, passing normals (actually &normals[addr], but that could be null too). If we look back at the code in VNorm, you can see that a is the name of the formal parameter. That‘s how the value from malloc got into a: it was passed at this call.
Now let‘s go ahead and actually fix this problem. To fix this problem you need to add some code after the call to malloc to test the result for null. If the result is null, then you would perform some kind of error recovery. In this case we can recover from the error by simply returning from the subroutine in question.
To modify the source we need to get into a real source editor on line 143 in apigeom.cpp, right after the malloc call. You can enter your normal source editor by double-clicking on that line in the sources view, or by right-clicking on that line and selecting Edit Source from the pop-up menu.
The editor window will open a new tab in the same tab group window that contains the results. So opening the source for editing will hide the result. You can get it back when you‘re ready to return to the results by clicking on the tab that says r000sc.

If you have a nice big screen, you might want to put the result and the source files you are editing in different tab group. It‘s probably nicer to use a different horizontal tab group than a different vertical tab group if you decide to try this out.
Let‘s get back to the editor. Here‘s what you see:
vertices = (vector *) malloc(m*n*sizeof(vector));
normals = (vector *) malloc(m*n*sizeof(vector));
Let‘s rewrite this code like this:
vertices = (vector *) malloc(m*n*sizeof(vector));
if (vertices == NULL) {
return;
}
normals = (vector *) malloc(m*n*sizeof(vector));
Type or
copy-paste these three lines code into the source exactly as shown, save the
result, and close the editor but don‘t rebuild the application yet. The astute
reader will already notice that this doesn‘t really fix the problem we intended
to fix, but go ahead anyway.
Now let‘s go back into the summary view. On Visual Studio you may need to click on the r000sc tab to get back to the Inspector GUI. To get from the Sources view to the Summary view click on the box that says Summary at the upper left of the Sources view.
Look at the problem set table. There are actually two problems related to this code: P94 (the one we‘ve been looking at), and P93, which is a similar problem with the line above it. In fact the fix we just typed in has actually corrected P93, but it didn‘t fix P94. Still, let‘s go ahead and use the right-click pop-up menu to change the state of P94 to say Fixed.
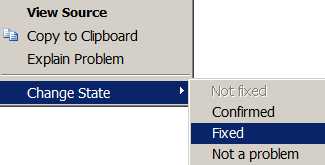
Notice that as soon as you do this, the problem disappears. Why did that happen? Oh, that‘s right, we still have that filter set to show only uninvestigated problems. To see that problem again, go over to Filters pane, go down to the bottom and turn off the Investigated filter by clicking on All:

Now you can see the problem again, and see that it really is marked as Fixed.

Now go ahead and rebuild the application to create a new analysis result and open the new result, r001sc. On Windows you can do all this by hitting the F7 key. You will want to close the Visual Studio Output window when the build completes.
The first thing you will notice is that most problems now say Not fixed instead of New in their state. This demonstrates the way that Inspector XE automatically initializes the state in the new result, r001sc, from the previous result, r000sc. Problems that were seen before are no longer considered New. They are simply not investigated yet, which is what the Not fixed state indicates.
You will also notice that the problem we investigated earlier, the unsafe format problem, is still in a Confirmed state, just as we marked it in r000sc.
Use the filter to select only the problems in file apigeom.cpp. You will notice that there are only 7 problems in r001sc (there were 8 in r000sc). This reflects the fact that our source change did fix one problem. Look at the problem that is the top of the list. Here‘s what it looks like now:

This is the problem that used to be number P94 in the old result. Now it‘s P93, but it‘s the same problem that we marked as Fixed in r000sc. Inspector XE correctly determined that this is the same problem, and since it‘s still present it must not really be Fixed after all. That‘s why the state was set to Regression instead. This indicates that a fix did not really make the problem go away.
Regression is considered an uninvestigated state, so this problem would still be seen if you set the filter to show only problems whose investigation state is Not investigated.
Summary and review
To review, we have seen:
Intel 编译器 静态安全检查 真心的很详细 转,布布扣,bubuko.com
原文:http://www.cnblogs.com/ustc-cui/p/3753051.html