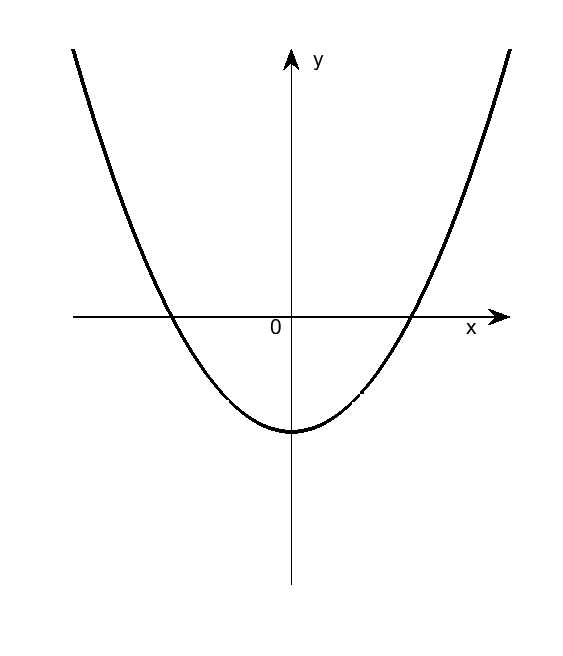
绘制y=x^2,并添加直角坐标轴。
clear;clc;close all
%% 绘制方程
x = -10:0.01:10;
figure;
y = x.^2-30;
plot(x,y,‘k‘,‘linewidth‘,2)
axis off
set(gcf,‘Position‘,[100 100 360 420]);
w1 = min(y);
w2 = max(y);
%% 绘制坐标轴
xlim = max(abs(x));
ylim = max(abs([w1 w2]));
axis(gca,[-xlim xlim -ylim ylim]);
xx = get(gca,‘xtick‘);
yy = get(gca,‘ytick‘);
dx = mean(diff(yy))/5;
dy = mean(diff(xx))/5;
axis(gca,[-xlim xlim -ylim ylim]);
set(gca,‘units‘,‘normalized‘);
pos1 = get(gca,‘position‘);
s1 = [pos1(1) pos1(2)+pos1(4)/2];
s2 = [pos1(1)+pos1(3) pos1(2)+pos1(4)/2];
s3 = [pos1(1)+pos1(3)/2 pos1(2)];
s4 = [pos1(1)+pos1(3)/2 pos1(2)+pos1(4)];
annotation(‘arrow‘,[s1(1) s2(1)],[s1(2) s2(2)])
annotation(‘arrow‘,[s3(1) s4(1)],[s3(2) s4(2)])
% 显示坐标轴标注
text(max(x)-2,-2,‘x‘) % 自己动手调整
text(1,max(y)-2,‘y‘) % 自己动手调整
text(-1,-2,‘0‘) % 自己动手调整
%% 保存图片
saveas(gcf,‘pic.png‘)
原文:http://www.cnblogs.com/liutongqing/p/6701995.html