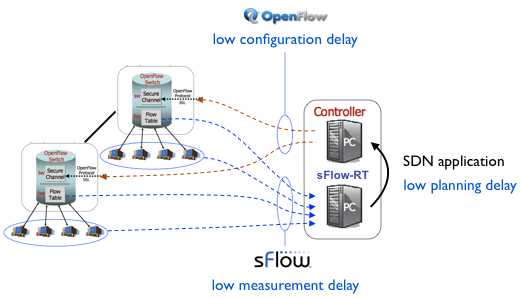
Figure 1: Low latency software defined networking control loop
The articles SDN and delay and Delay and stability describe the critical importance of low measurement delay in constructing stable and effective controls. This article will examine the difference in measurement latency between sFlow and NetFlow/IPFIX and their relative suitability for driving control decisions.

Figure 2: sFlow and NetFlow agent architectures
Figure 2 illustrates shows the architectural differences between the sFlow and IPFIX/NetFlow instrumentation in a switch:
- NetFlow/IPFIX Cisco NetFlow and IPFIX (the IETF standard based on NetFlow) define a protocol for exporting flow records. A flow record summarizes a set of packets that share common attributes - for example, a typical flow record includes ingress interface, source IP address, destination IP address, IP protocol, source TCP/UDP port, destination TCP/UDP port, IP ToS, start time, end time, packet count and byte count. Figure 2 shows the steps performed by the switch in order to construct flow records. First the stream of packets is likely to be sampled (particularly in high-speed switches). Next, the sampled packet header is decoded to extract key fields. A hash function is computed over the keys in order to look up the flow record in the flow cache. If an existing record is found, its values are updated, otherwise a record is created for the new flow. Records are flushed from the cache based on protocol information (e.g. if a FIN flag is seen in a TCP packet), a timeout, inactivity, or when the cache is full. The flushed records are finally sent to the traffic analysis application.
- sFlow With sFlow monitoring, the decode, hash, flow cache and flush functionality are no longer implemented on the switch. Instead, sampled packet headers are immediately sent to the traffic analysis application which decodes the packets and analyzes the data. In addition, sFlow provides a polling function, periodically sending standard interface counters to the traffic analysis applications, eliminating the need for SNMP polling, see Link utilization.
The flow cache introduces significant measurement delay for NetFlow/IPFIX based monitoring since the measurements are only accessible to management applications once they are flushed from the cache and sent to a traffic analyzer. In contrast, sFlow has no cache - measurement are immediately sent and can be quickly acted upon, resulting in extremely low measurement delay.
Open vSwitch is a useful testbed for demonstrating the impact of the flow cache on measurement delay since it can simultaneously export both NetFlow and sFlow, allowing a side-by-side comparison. The article, Comparing sFlow and NetFlow in a vSwitch, describes how to configure sFlow and NetFlow on the Open vSwitch and demonstrates some of the differences between the two measurement technologies. However, this article focusses on the specific issue of measurement delay.
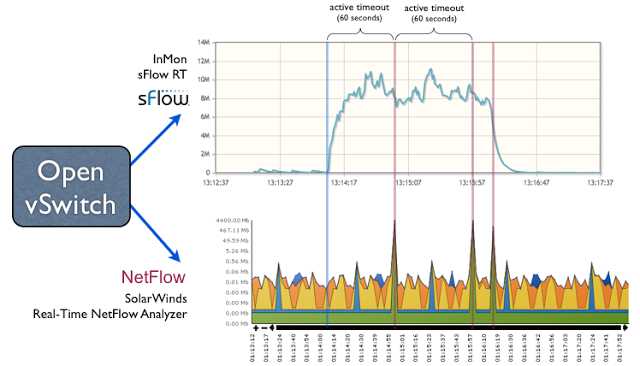
Figure 3 shows the experimental setup, with sFlow directed to InMon sFlow-RT and NetFlow directed to SolarWinds Real-Time NetFlow Analyzer.
Note: Both tools are available at no charge, making it easy for anyone to reproduce these results. 
Figure 3: Latency of large flow detection using sFlow and NetFlow
The charts in Figure 3 show how each technology reports on a large data transfer. The charts have been aligned to have the same time axis so you can easily compare them. The vertical blue line indicates the start of the data transfer.
- sFlow By analyzing the continuous stream of sFlow messages from the switch, sFlow-RT immediately detects and continuously tracks the data transfer from the moment the data transfer starts to its completions just over two minutes later.
- NetFlow The Real-Time NetFlow Analyzer doesn‘t report on the transfer until it receives the first NetFlow record 60 seconds after the data transfer started, indicated by the first vertical red line. The 60 delay corresponds to the active timeout used to flush records from the flow cache. A second NetFlow record, indicated by the second red line, is responsible for the second spike 60 seconds later, and a final NetFlow record, received after the transfer completes and indicated by the third red line, is responsible for the third spike in the chart.
Note: A one minute active timeout is the lowest configurable value on many Cisco switches (the default is 30 minutes), see Configuring NetFlow and NetFlow Data Export.
The large measurement delay imposed by the NetFlow/IPFIX flow cache makes the technology unsuitable for SDN control applications. The measurement delay can lead to instability since the controller is never sure of the current traffic levels and may be taking action based on stale data reported for flows that are no longer active.
In contrast, the sFlow measurement system quickly detects and continuously tracks large flows, allowing an SDN traffic management application to reconfigure switches and balance the paths that active flows take across the network.[转]Rapidly detecting large flows, sFlow vs. NetFlow/IPFIX,布布扣,bubuko.com
[转]Rapidly detecting large flows, sFlow vs. NetFlow/IPFIX
原文:http://www.cnblogs.com/popsuper1982/p/3800580.html