转载:http://www.cnblogs.com/xudongliang/p/7283733.html
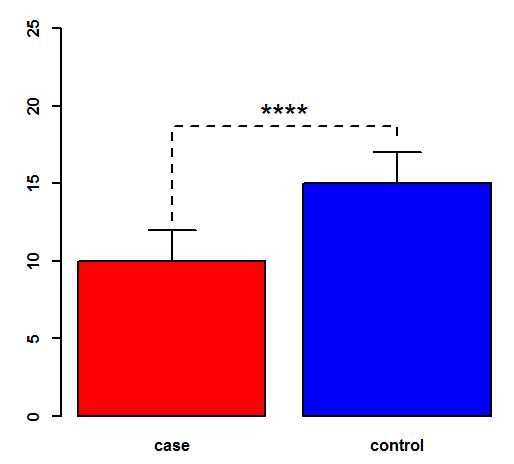
data <- data.frame(mean = c(10, 15), sd = c(12, 17))
rownames(data) <- c("case", "control")
par(lwd = 2)
b <- barplot(data$mean, names.arg = rownames(data), col = c("red", "blue"), ylim = c(0, 25), axes = F, font = 2)
arrows(b[1], data$mean[1], b[1], data$sd[1], angle = 90)
arrows(b[2], data$mean[2], b[2], data$sd[2], angle = 90)
lines( x = c(b[1], b[1], b[2], b[2]), y = c( data$sd[1] * 1.05 , data$sd[2] * 1.1, data$sd[2] * 1.1, data$sd[2] * 1.05), lty = 2)
text( x = b[1] + (b[2] - b[1]) / 2, y = data$sd[2] * 1.1, label = "****", cex = 2, adj = c(0.5, 0))
axis(side = 2, lwd = 2, font = 2, cex = 1.5)
原文:http://www.cnblogs.com/renping/p/7399830.html