
import matplotlib.pyplot as plt
import numpy as np
x = np.linspace(-3,3,50)
y = 2*x+1
plt.figure(num=‘zhushi‘,figsize=(8,5))
plt.plot(x,y,)
ax = plt.gca()
ax.spines[‘right‘].set_color(‘none‘)
ax.spines[‘top‘].set_color(‘none‘)
ax.xaxis.set_ticks_position(‘bottom‘)
ax.yaxis.set_ticks_position(‘left‘)
ax.spines[‘bottom‘].set_position((‘data‘,0))
ax.spines[‘left‘].set_position((‘data‘,0))
x0 = 1
y0 = 2*x0+1
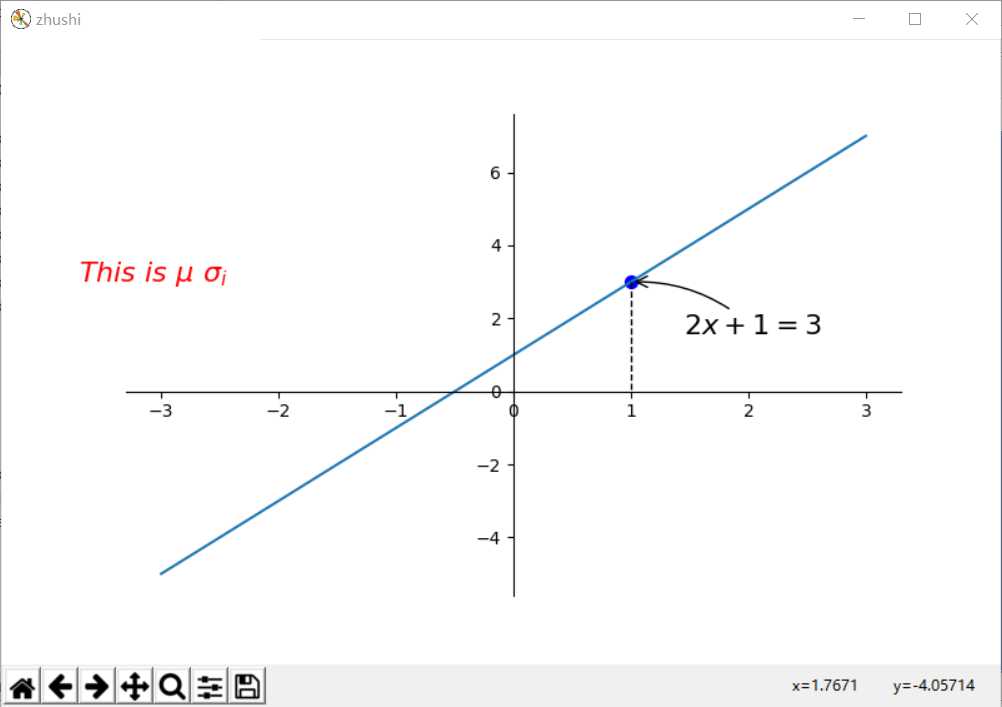
plt.scatter(x0,y0,s=50,color=‘b‘)#s=大小
plt.plot([x0,x0],[y0,0],‘k--‘,lw=1.0)#‘k--‘线的样式,颜色,lw=宽度;画出两个点,(x0,y0)和(x0,0)
#   method 1
plt.annotate(r‘$2x+1=%s$‘% y0,xy=(x0,y0),xycoords=‘data‘,xytext = (+30,-30),textcoords=‘offset points‘,fontsize=16,arrowprops=dict(arrowstyle=‘->‘,connectionstyle=‘arc3,rad=.2‘))
#xy=开始打印的坐标,xycoords=以什么为基准,textcoords=从这个点开始打印,fonsize=字体的大小,arrowprop=角度和模型
# method 2
plt.text(-3.7,3,r‘$This\ is\ \mu\ \sigma_i$‘,fontdict={‘size‘:16,‘color‘:‘r‘})
plt.show()
原文:http://www.cnblogs.com/unicornGd/p/7521388.html