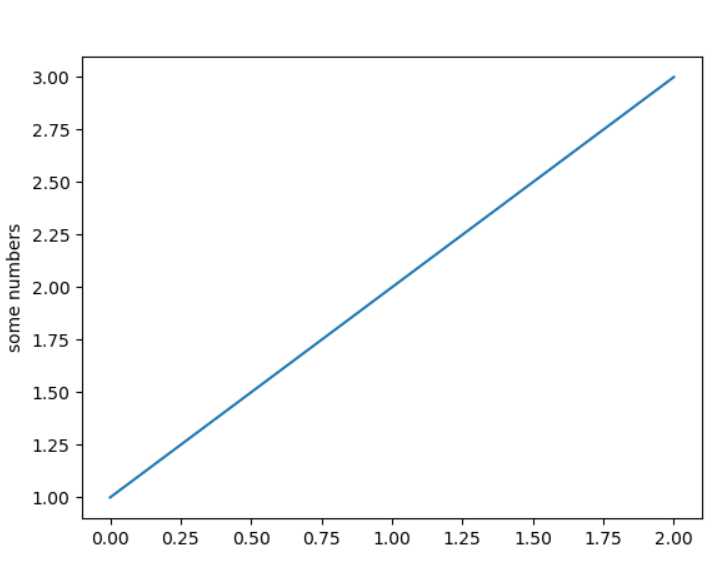
画直线图
import matplotlib.pyplot as plt
plt.plot([1,2,3])
plt.ylabel(‘some numbers‘)
plt.show()
Matplotlib可视化
原文:https://www.cnblogs.com/com-on/p/8496128.html