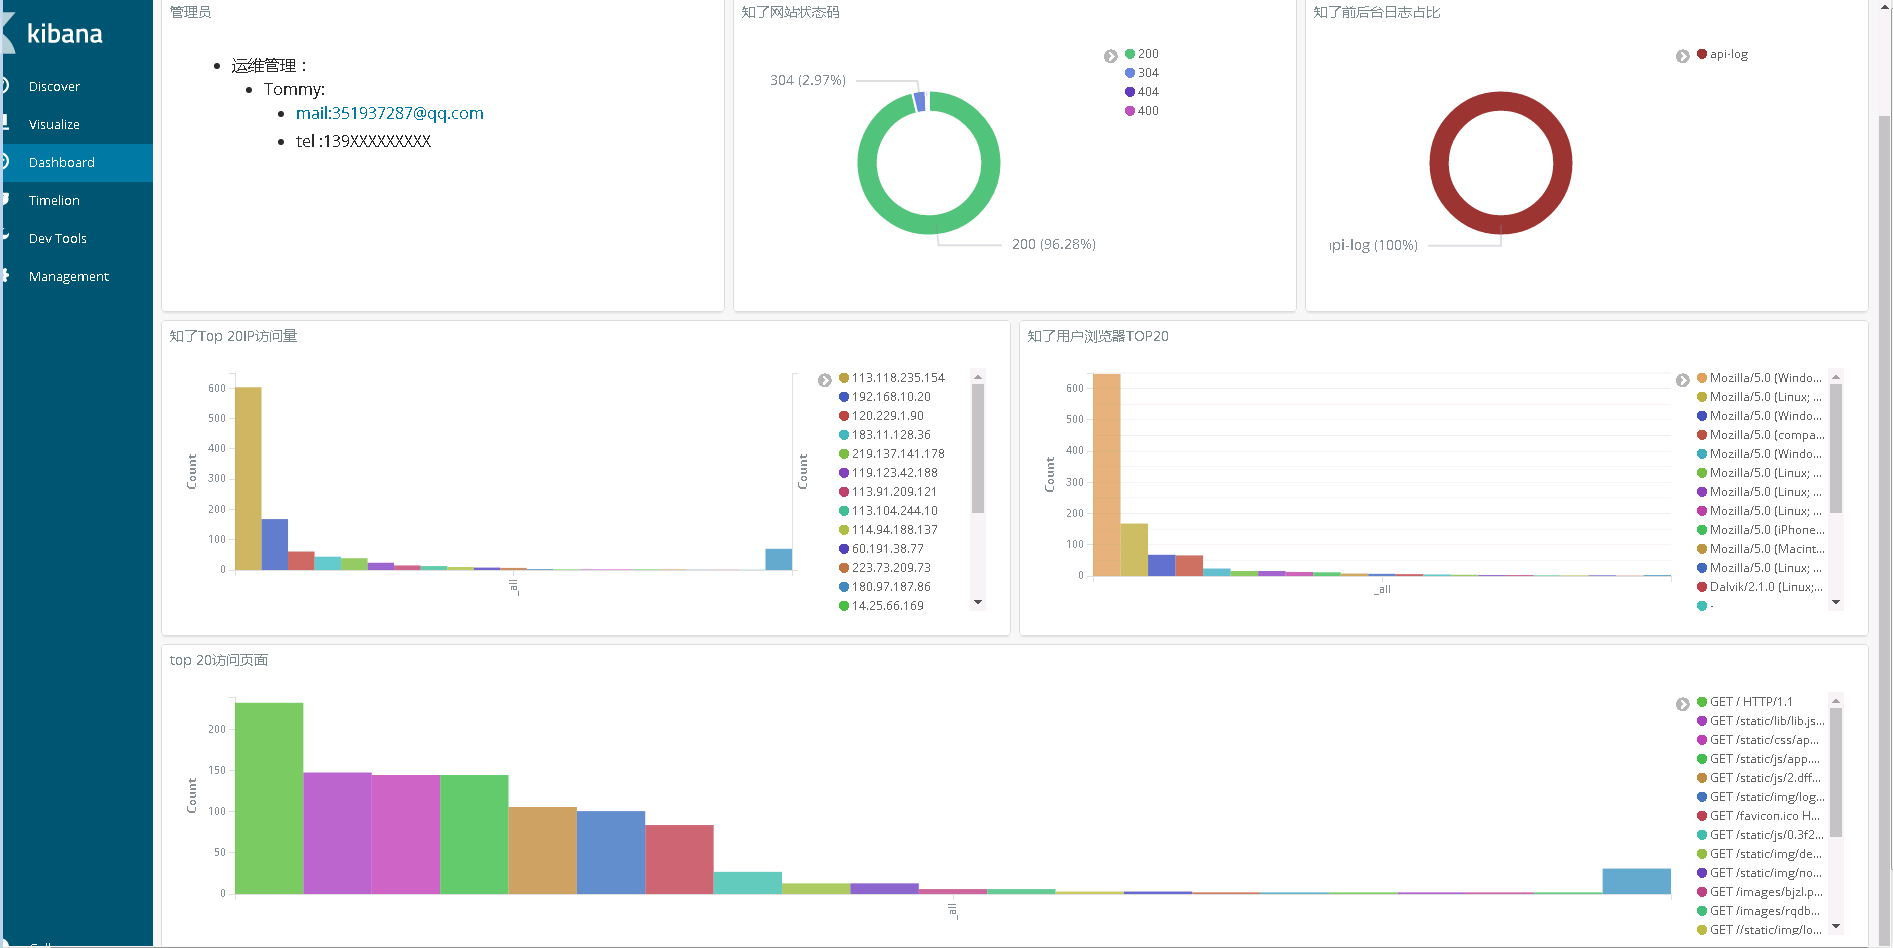
先上一个我最后弄出来的图形:
nginx服务器 安装filebeat
nginx配置日志格式为json,修改nginx配置文件:
vim /usr/local/nginx/conf/nginx.conf
在http标签下添加:
log_format logstash_json '{ "@timestamp": "$time_local", '
'"@fields": { '
'"remote_addr": "$remote_addr", '
'"remote_user": "$remote_user", '
'"body_bytes_sent": "$body_bytes_sent", '
'"request_time": "$request_time", '
'"status": "$status", '
'"request": "$request", '
'"request_method": "$request_method", '
'"http_referrer": "$http_referer", '
'"body_bytes_sent":"$body_bytes_sent", '
'"http_x_forwarded_for": "$http_x_forwarded_for", '
'"http_user_agent": "$http_user_agent" } }';
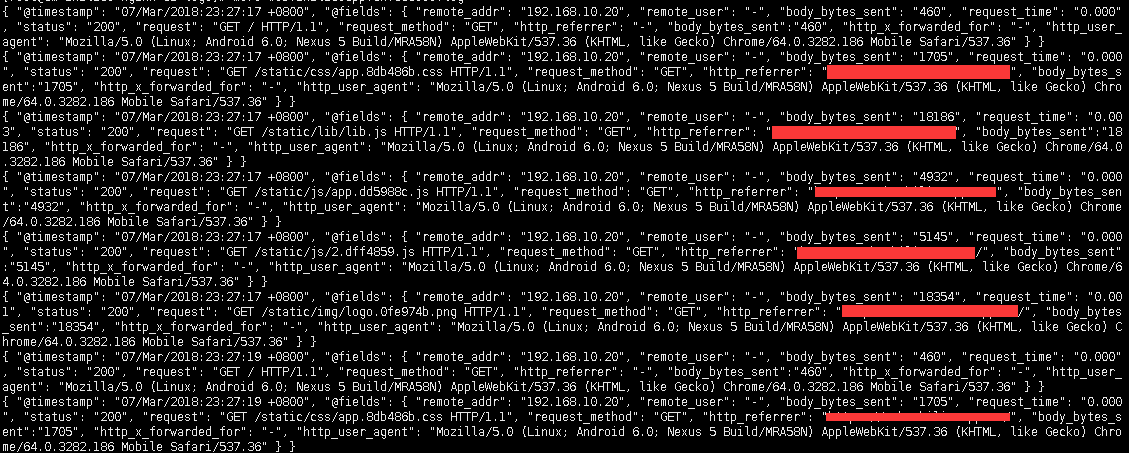
在需要收集日志server添加以下 access_log logs/www.access.log logstash_json; # logstash_json需要和上面定义名字相同 nginx从新加载,加载,就能看到新生成的日志就是json格式
/usr/local/nginx/sbin/nginx -t
/usr/local/nginx/sbin/nginx -s reload
生成后日志截图
wget https://artifacts.elastic.co/downloads/beats/filebeat/filebeat-6.2.2-x86_64.rpm
rpm -ivh filebeat-6.2.2-x86_64.rpm
编辑filebeat配置文件
vim /etc/filebeat/filebeat.yml
注释原来的:

#- type: log
#  paths:
#    - /var/log/*.log

在注释下面添加自己的定义的log
- input_type: log
  paths:
    - /usr/local/nginx/logs/xxx.access.log
  json.keys_under_root: true  #收集json格式
  json.overwrite_keys: true   #收集json格式
  fields:                   #当我们需要收集多个log并且分开命名需要
    log_source: zhiliao-www

#-------------------------- Elasticsearch output --------------------------
#配置输出
setup.template.name: "zhiliao-nginx-01"
setup.template.pattern: "zhiliao-nginx-01-*"
output.elasticsearch:
  hosts: ["192.168.10.63:9200"]
  index: "zhiliao-nginx-01-%{+yyyy.MM.dd}"
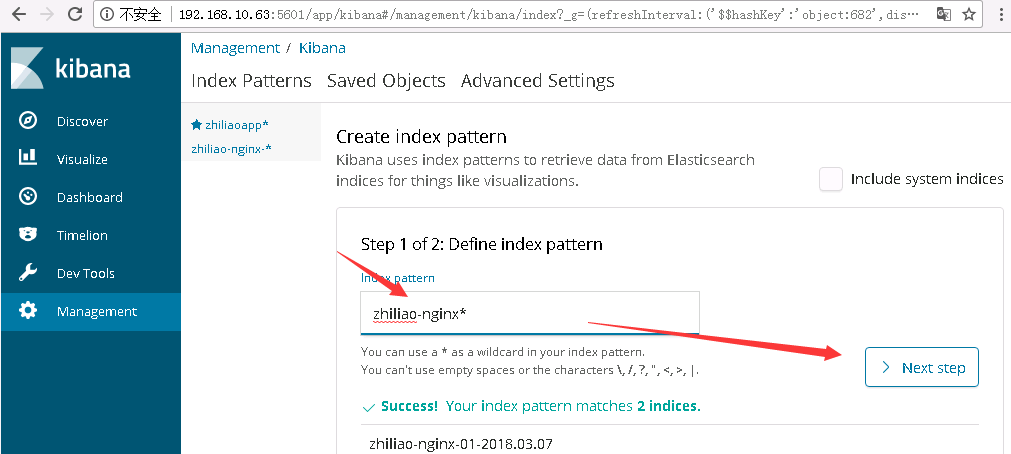
启动filebeat: /etc/init.d/filebeat start输入zhiliao-nginx*自动匹配到了目前的索引,点击next step添加
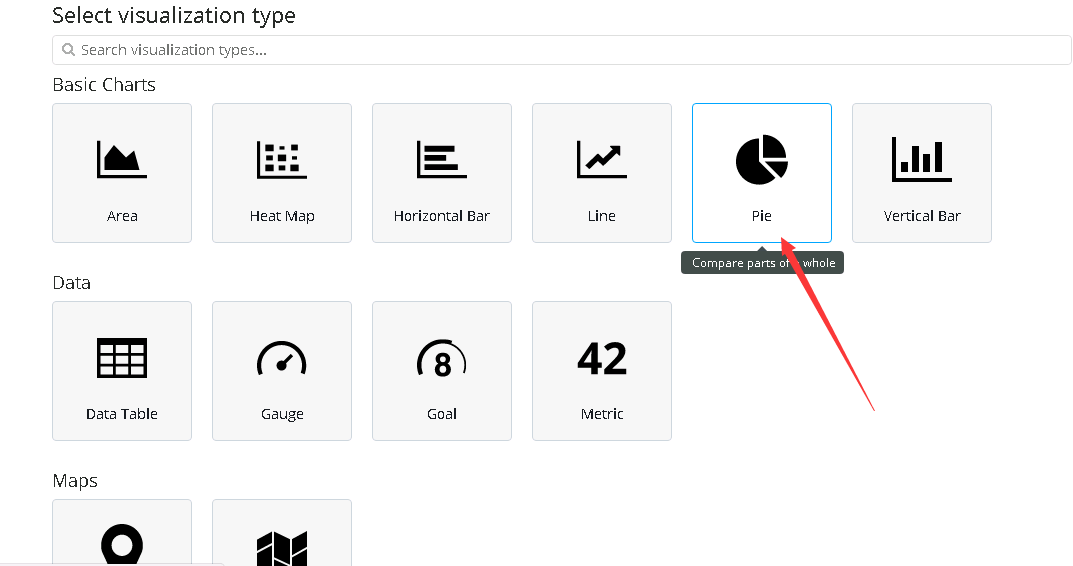
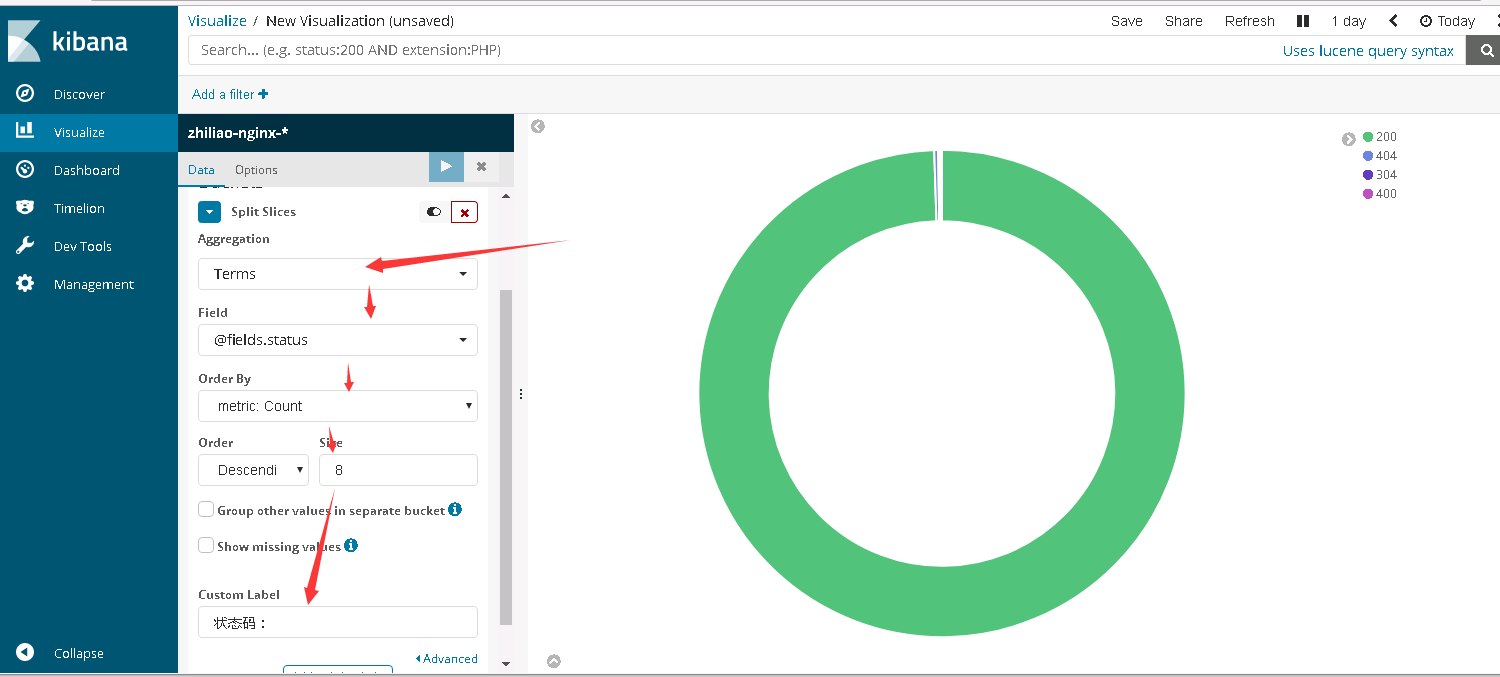
网站状态码占比举例
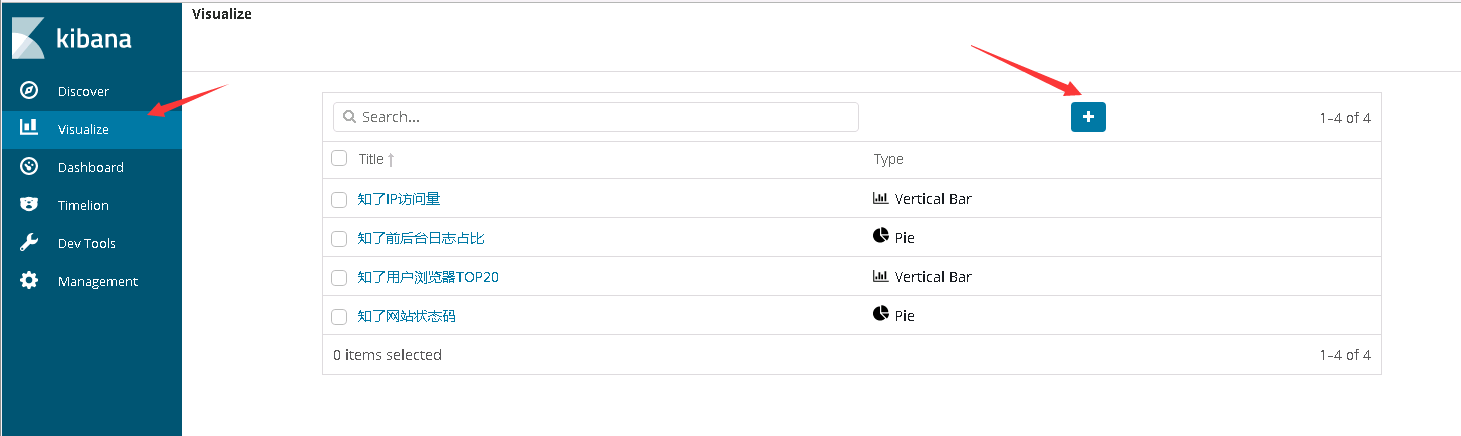
选择pie饼状图
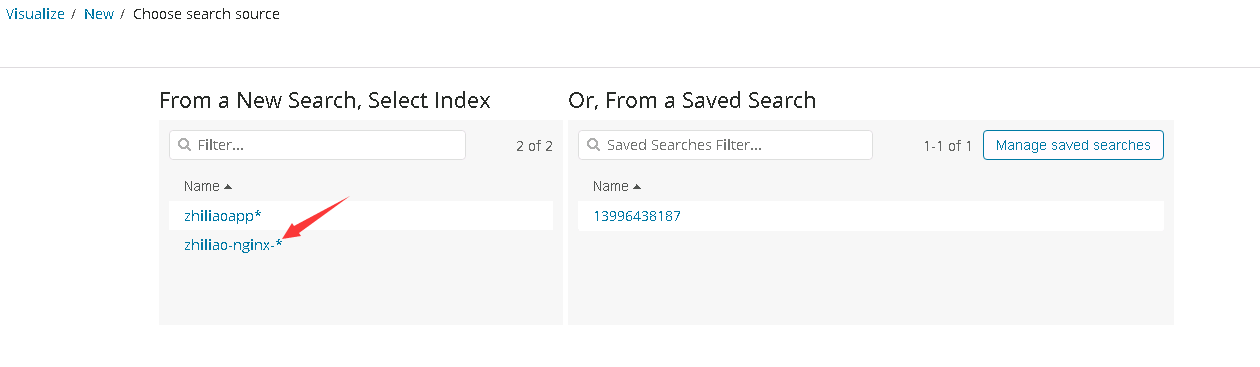
选择刚才添加的nginx索引
选择Split Slies
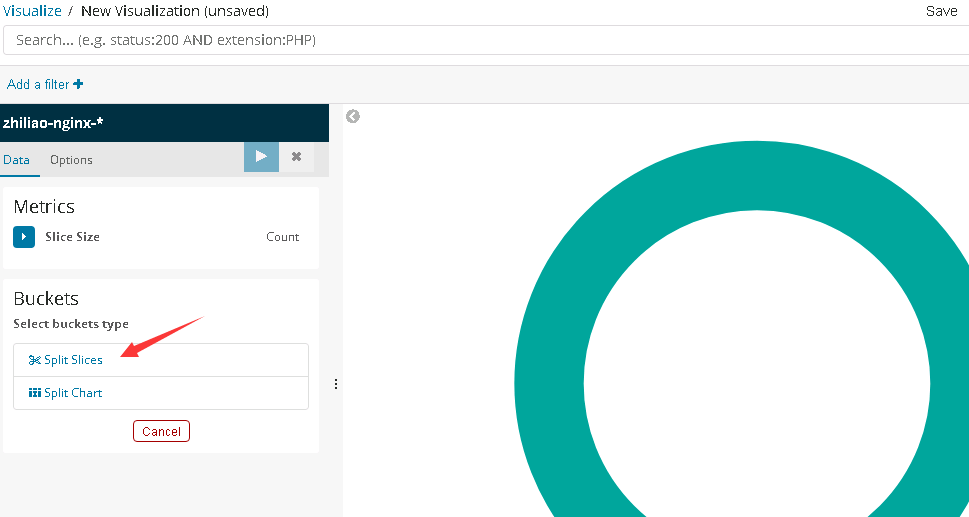
Aggregation 选择 Terms
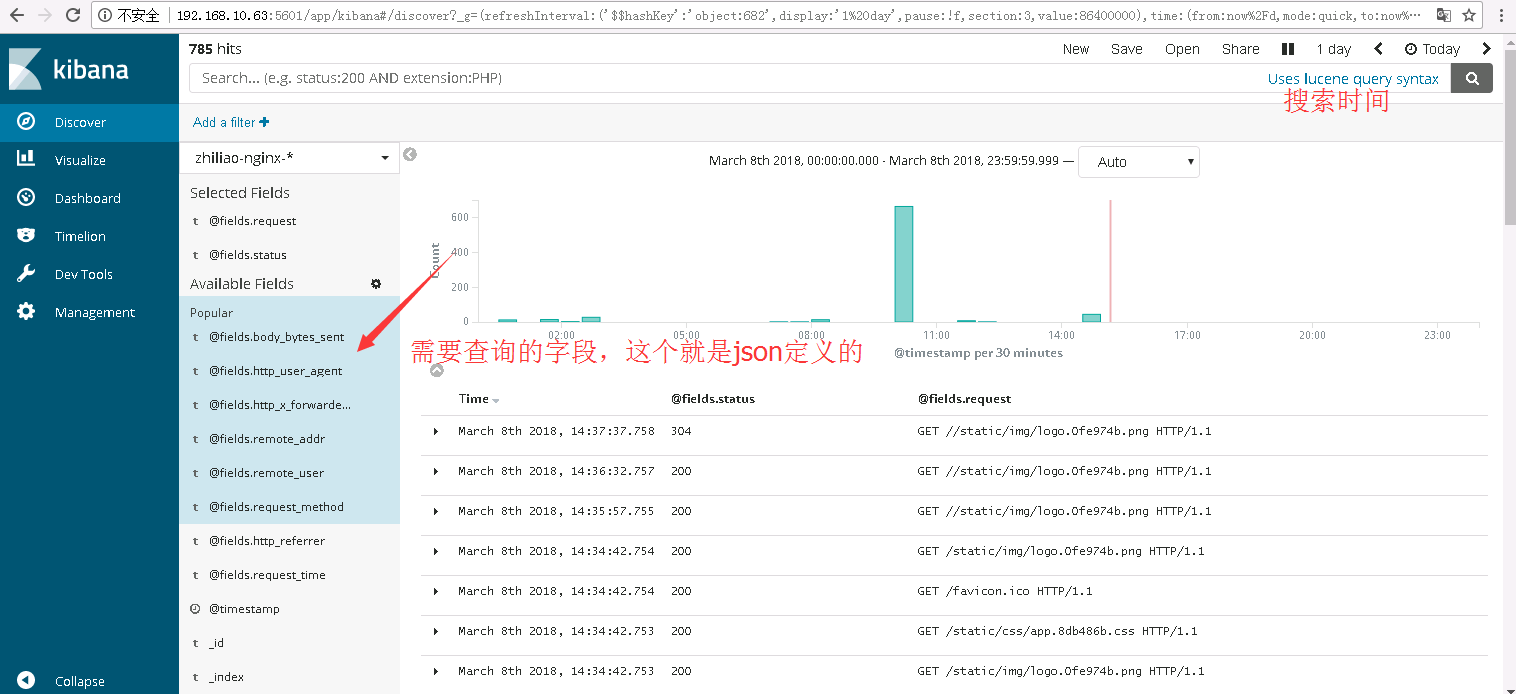
Field字段选择 json传递过来后的字段,可以在首页查看到状态码是@fields.status
Order By选择count
Order :Descendi 个数8(这个显示多少自己定义,状态码显示8个够了)
Custom Label:状态码: (这个是在鼠标放在对应区域显示)
然后点击三角箭头就可以预览
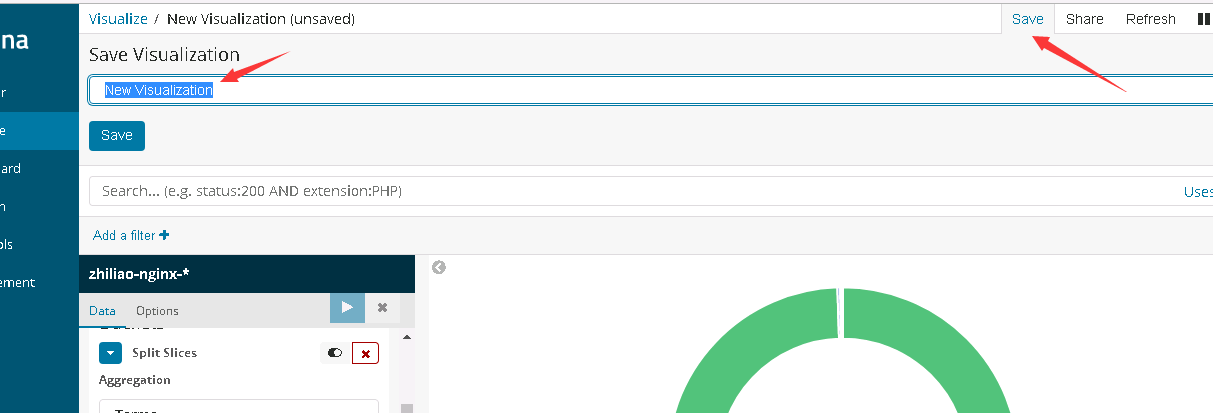
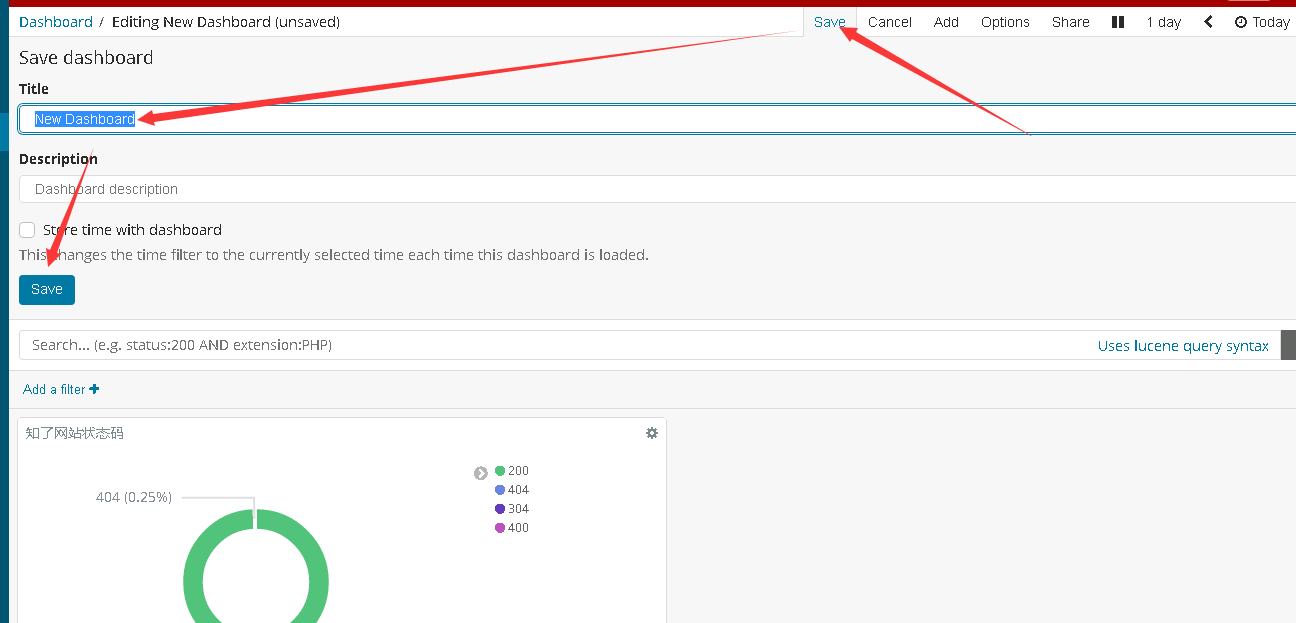
保存自定义的图表
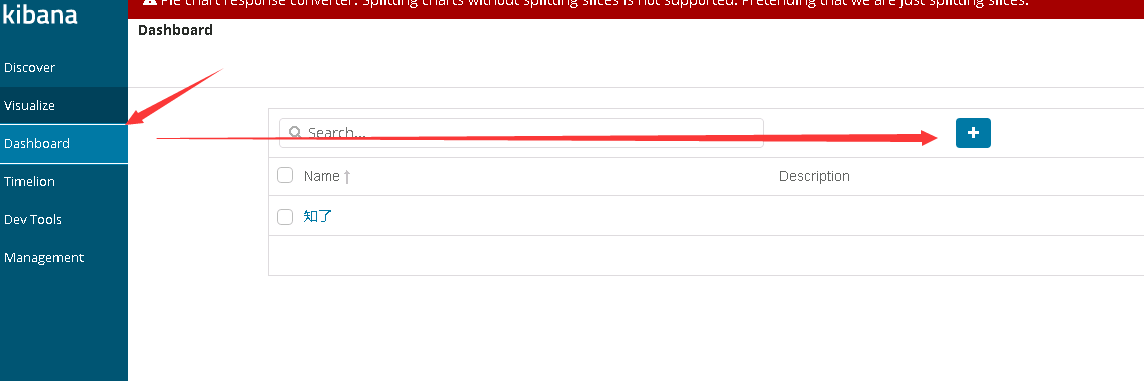
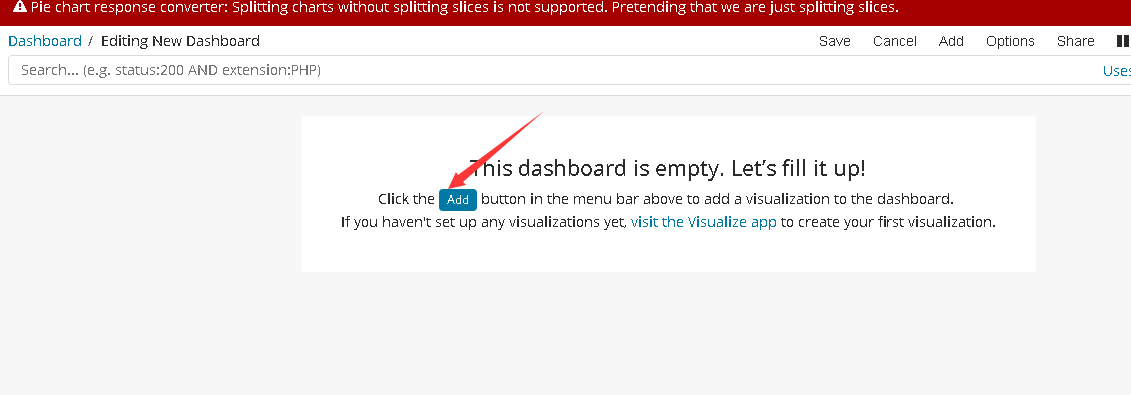
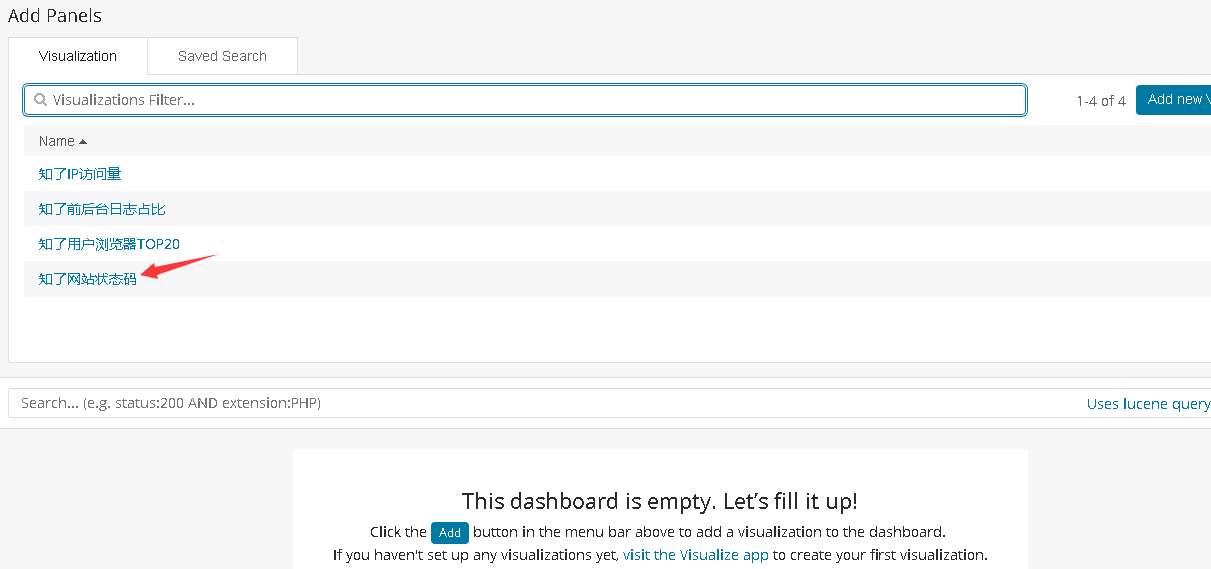
新建一个 Dashboard 加载我们添加的Visualization
原文:http://blog.51cto.com/linyingyong/2084810