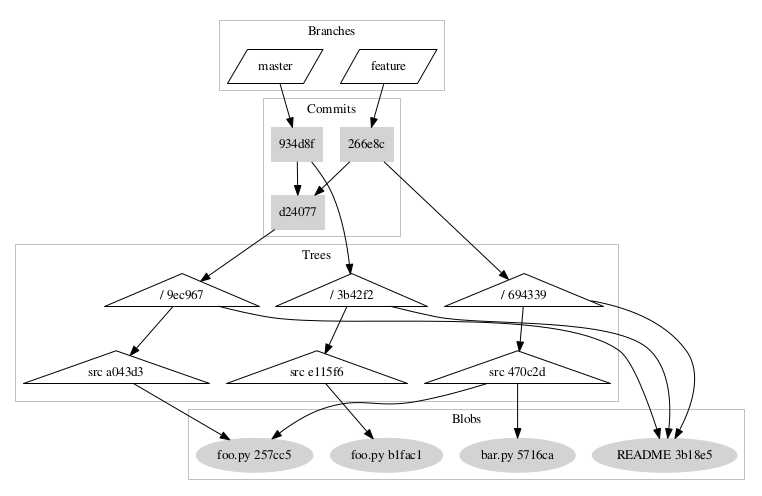
I wrote a small tool git-graph.py over the weekend which can be used to generate the graph for the data model of a Git repository. The primary purpose is to help Git learners better understand the Git data model through visualization. You can experiment with various git operations (e.g., add/delete/edit files or directories, merge branches, etc), commit, then run this tool to see what happened to the data model under the hood.
References on Git internals:
Pro Git- Git Internals - Git Objects
Understanding Git?—?Data Model
Learning Git Internals by Example
OSCON 2016: Dissecting Git‘s Guts - Git Internals - Emily Xie.
Visualizing the Git data model
原文:https://www.cnblogs.com/weidagang2046/p/git-graph.html