$ sed -i "s/SELINUX=enforcing/SELINUX=disabled/g" /etc/selinux/config
$ sed -i ‘s/SELINUXTYPE=targeted/#&/‘ /etc/selinux/config
$ setenforce 0  # 可以设置配置文件永久关闭
$ systemctl stop iptables.service
$ systemctl stop firewalld.service
$ reboot  # 更改selinux需要重启系统才会生效
#修改字符集,否则可能报 input/output error的问题,因为日志里打印了中文
$ localedef -c -f UTF-8 -i zh_CN zh_CN.UTF-8
$ export LC_ALL=zh_CN.UTF-8
$ echo ‘LANG=zh_CN.UTF-8‘ > /etc/locale.conf
3.安装配置zabbix
#安装 MySQL
本教程使用 Mysql 作为数据库,如果不使用 Mysql 可以跳过相关 Mysql 安装和配置
$ yum -y install mariadb mariadb-devel mariadb-server  # centos7下安装的是mariadb
$ systemctl enable mariadb
$ systemctl start mariadb#设置mysql的root密码$ mysqladmin -u root -h localhost password ‘xxxxxxxx‘
#创建数据库 zabbix 并授权
$ mysql -uroot -pxxxxxx
> create database zabbix character set utf8 collate utf8_bin;
> grant all privileges on zabbix.* to zabbix@localhost identified by ‘xxxxxxxx‘;
> quit
#安装zabbix-server、zabbix-agent及相关组件
$ rpm -i http://repo.zabbix.com/zabbix/3.4/rhel/7/x86_64/zabbix-release-3.4-2.el7.noarch.rpm
$ yum install zabbix-server-mysql zabbix-web-mysql zabbix-agent#导入zabbix初始化数据$ zcat /usr/share/doc/zabbix-server-mysql*/create.sql.gz | mysql -uzabbix -pxxxxxxxx zabbix
#修改zabbix-server配置文件$ vim /etc/zabbix/zabbix_server.conf
修改连接数据库的配置
DBHost=localhost
DBName=zabbix
DBUser=zabbix
DBPassword=xxxxxxxx
#修改PHP时区$ vim /etc/httpd/conf.d/zabbix.conf
将下面这行修改为亚洲上海
php_value date.timezone Asia/Shanghai
#启动zabbix-server、zabbix-agent、httpd
$ systemctl restart zabbix-server zabbix-agent httpd
$ systemctl enable zabbix-server zabbix-agent httpd
4.配置zabbix前端
打开浏览器,访问http://192.168.2.205/zabbix,会看到如下页面
点击“Next step”,下一步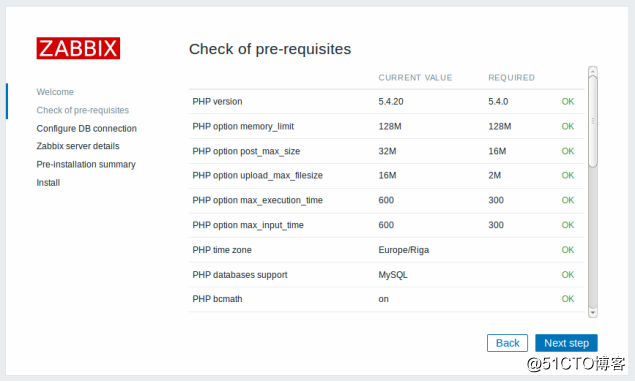
确保PHP所有项目都OK,然后点击“Next step”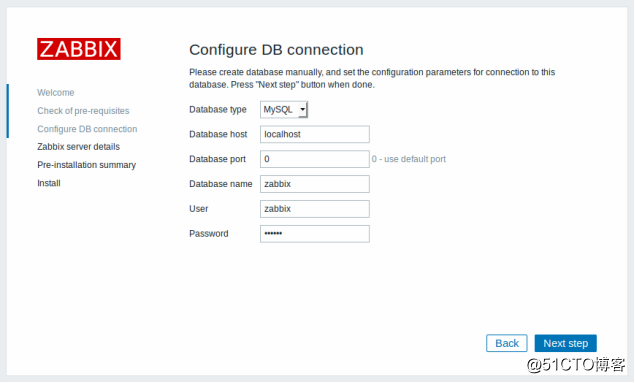
此处为连接mysql的配置,请按照前面安装时的配置填写,然后点击“Next step”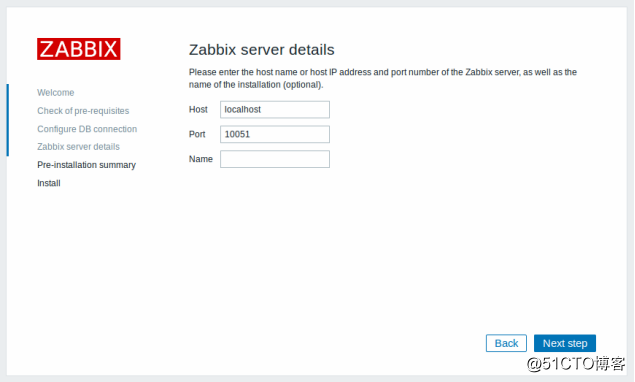
Name处可以填写网站的名称,然后点击“Next step”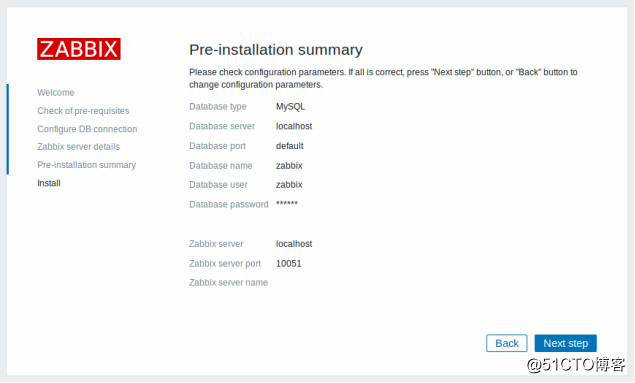

根据提示可以看到上面图形界面的操作都写到一个配置文件中,/etc/zabbix/web/zabbix.conf.php,确认无误后,点击“Finish”
登陆zabbix前端,默认账号为?Admin,默认密码为zabbix
5.配置zabbix中文界面
#修改PHP配置文件
确认zabbix是否开启了中文件支持功能,/usr/share/zabbix/include/locales.inc.php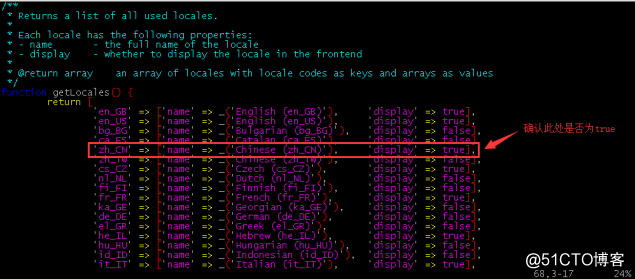
浏览器登陆zabbix前端,设置语言为Chinese(zh_CN),然后点击“Update”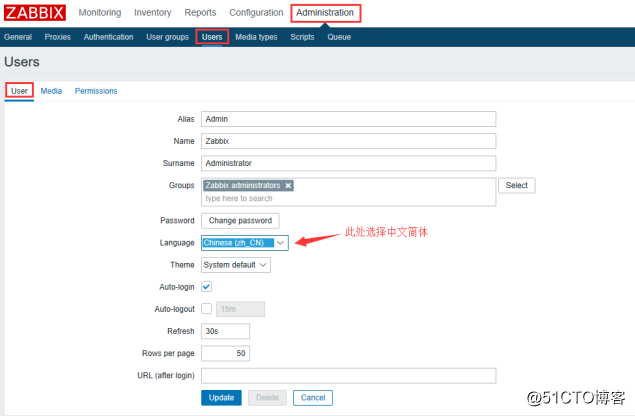
此时刷新一下页面,便可以看到中文了。
6.安装配置iptables
#安装iptables$ yum -y install iptables iptables-services
#配置iptables$ vim /etc/sysconfig/iptables # 添加允许访问80端口的策略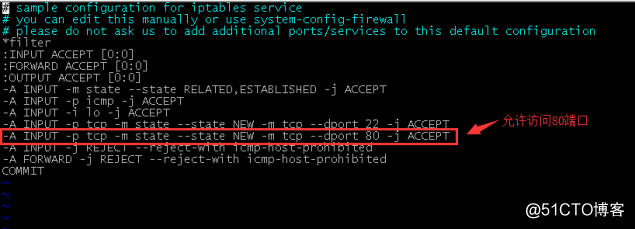
#启动iptables
$ systemctl start iptables.service
$ systemctl enable iptables.service#查看iptables状态$ systemctl status iptables.service
二、监控Linux主机
2.1.安装zabbix-agent
$ rpm -i http://repo.zabbix.com/zabbix/3.4/rhel/7/x86_64/zabbix-release-3.4-2.el7.noarch.rpm
$ yum install -y zabbix-agent zabbix-get2.2.配置zabbix-agent$ vim /etc/zabbix/zabbix_agentd.conf # 修改agent配置文件
Server=192.168.2.205 # zabbix服务端内网IP
ServerActive=192.168.2.205 # zabbix服务端内网IP,Active表示agent主动推送
Hostname=Jump Server # zabbix客户端主机名称,需要和web端添加的名称一致
Include=/etc/zabbix/zabbix_agentd.d/*.conf
2.3.配置iptables$ vim /etc/sysconfig/iptables # 添加允许访问10050端口的策略
-A INPUT -s 192.168.2.205 -p tcp -m multiport --dports 10050 -j ACCEPT$ systemctl restart iptables.service # 重启iptables
2.4.Web端添加Linux主机
配置-主机-创建主机,按下图配置好后点击“更新”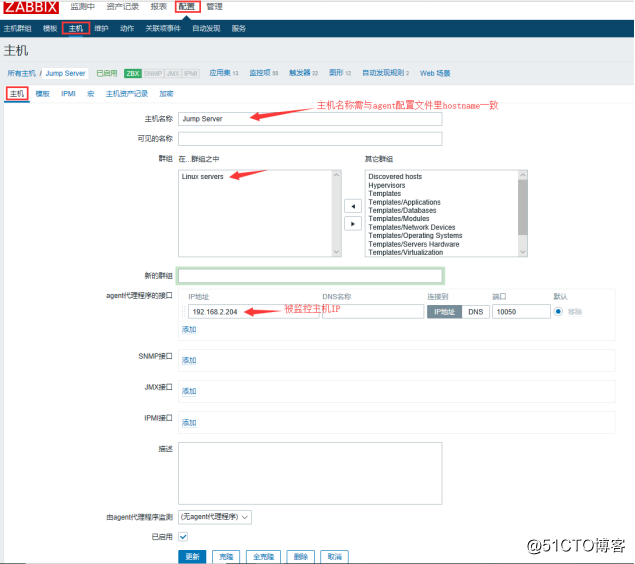
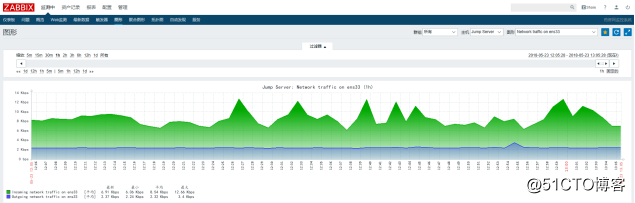
2.5.监控效果图
监测中-图形,选择前面刚添加的主机Jump Server,便可看到监控图。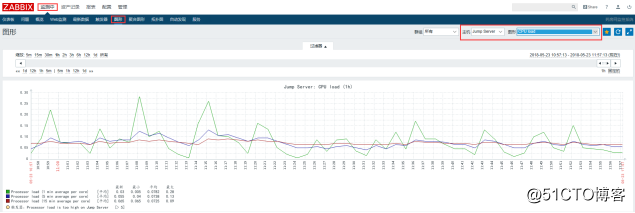
三、监控windows主机
3.1.下载zabbix-agent
浏览器访问zabbix官网:https://www.zabbix.com/download_agents,选择windows对应的版本下载。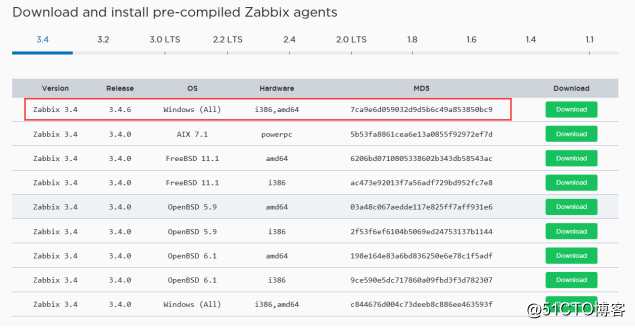

3.2.安装配置zabbix-agent
解压zabbix_agents_3.4.6.win.zip,会看到bin和conf两个目录,进入到conf目录下,修改zabbix_agentd.win.conf配置文件。
LogFile=D:\zabbix_agents_3.4.6.win\log\zabbix_agentd.log
Server=192.168.2.205
ListenPort=10050
ServerActive=192.168.2.205
Hostname=Xuad Server
以管理员方式运行CMD,执行安装程序
D:\zabbix_agents_3.4.6.win\bin\win64\zabbix_agentd.exe -c D:\zabbix_agents_3.4.6.win\conf\zabbix_agentd.win.conf -i  #加载配置文件
D:\zabbix_agents_3.4.6.win\bin\win64\zabbix_agentd.exe -c D:\zabbix_agents_3.4.6.win\conf\zabbix_agentd.win.conf -s  #添加windows自启动服务
#确认10050端口已监听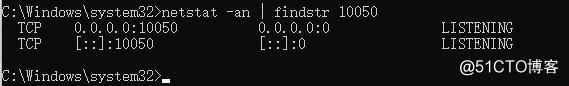
#卸载zabbix-agent服务
先停止服务,然后以管理员方式运行CMD,执行下面的命令
sc delete "Zabbix Agent"
3.3.防火墙开放10050端口
以管理员方式运行CMD,执行下面命令,添加开放10050端口策略。netsh advfirewall firewall add rule name="Zabbix_Agent_tcp" dir=in protocol=tcp localport=10050 remoteip=192.168.2.205 action=allow
注:remoteip=192.168.2.205表示只允许192.168.2.205访问10050端口,此为zabbix-server的IP。
3.4.web端添加windows主机
#创建主机群组
配置-主机群组,输入组名称,然后点击“更新”。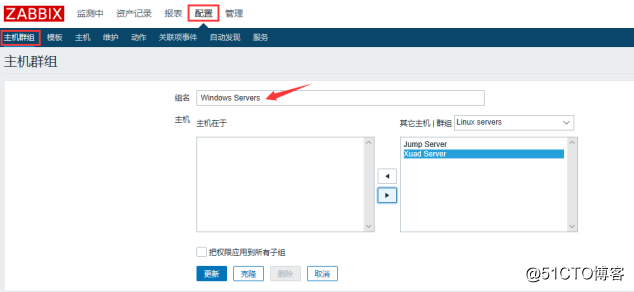
#创建windows主机
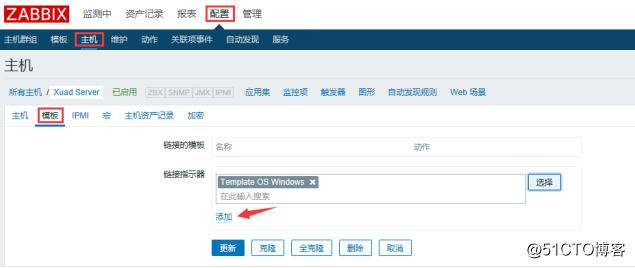
配置-主机-创建主机,按下图填写好后,点击“模板”。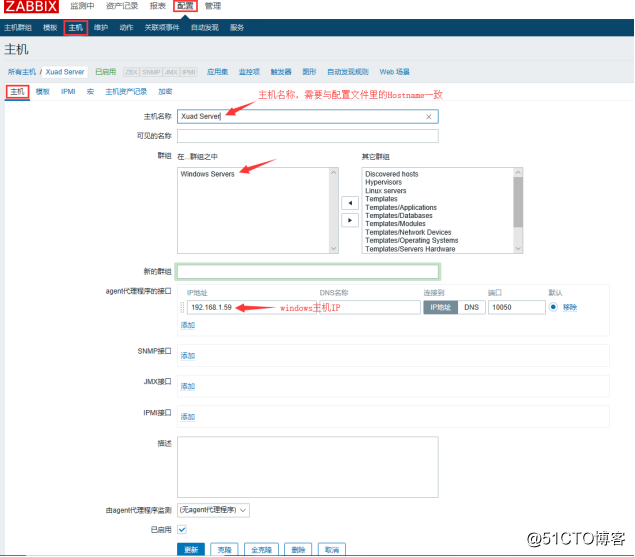
配置-主机-模板,点击“选择”,勾选“Template OS Windows”,点击“选择”,然后点击“添加”,最后点击“更新”。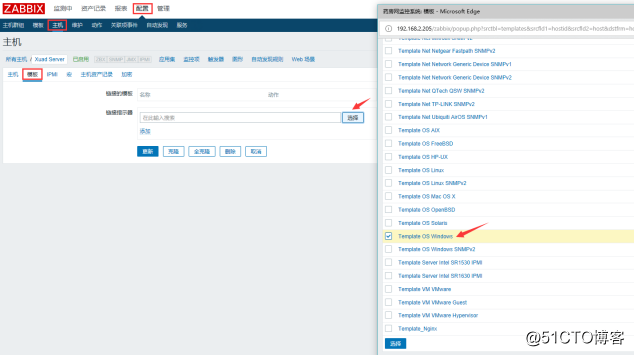
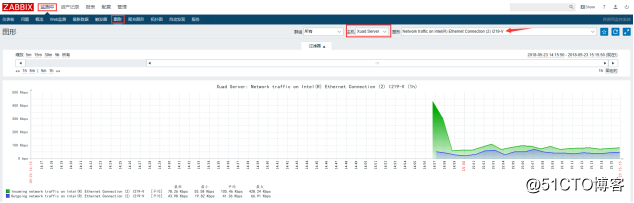
3.5.监控效果图
监测中-图形,选择前面刚添加的主机Xuad Server,便可看到监控图。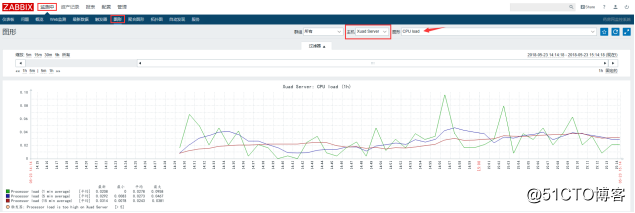
四、监控apache状态
4.1.启用apache的status功能$ vim /etc/httpd/conf/httpd.conf
#编辑httpd.conf文件添加如下内容
ExtendedStatus On
<Location /server-status>
    SetHandler server-status
    Order deny,allow
    Allow from 192.168.2.204   # apache主机IP
</Location>#重启apache$ systemctl restart httpd
浏览器访问http://192.168.2.204/server-status,确认配置生效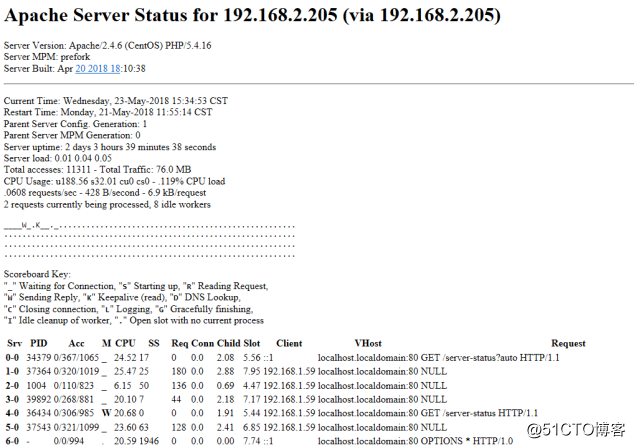
4.2.下载并配置zapache
#下载zapache
$ wget https://github.com/lorf/zapache/archive/master.zip
$ unzip master.zip
文件说明:
httpd-server-status.conf.sample 是用于配置server-status的上个步骤已经配置过了
userparameter_zapache.conf.sample 、zapache 关键的文件
zapache-template-active.xml zapache-template.xml模板文件,这两个文件需要导入到web端
#配置zapache$ cd zapache-master
将zapache配置文件放到相应目录下
$ cp userparameter_zapache.conf.sample /etc/zabbix/zabbix_agentd.d/
$ cd /etc/zabbix/zabbix_agentd.d/
$ mv userparameter_zapache.conf.sample userparameter_zapache.conf查看配置userparameter_zapache.conf内容$ cat /etc/zabbix/zabbix_agentd.d/userparameter_zapache.conf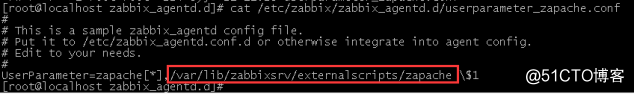
可以看到应当把解压出来的zapache文件放到/var/lib/zabbixsrv/externalscripts/目录下,当然也可以修改这个目录位置,改为自定义的,我这里就用默认配置文件里的目录,因此,创建这个目录。
$ mkdir -p /var/lib/zabbixsrv/externalscripts/
$ cp zapache /var/lib/zabbixsrv/externalscripts/
$ chmod +x /var/lib/zabbixsrv/externalscripts/zapache
查看zabbix-agent配置文件,确保zabbix_agentd.d目录开启
Include=/etc/zabbix/zabbix_agentd.d/*.conf
4.3.web端导入模板
配置-模板-导入,点击“浏览”,选择模板文件点击“打开”,点击“导入”即可。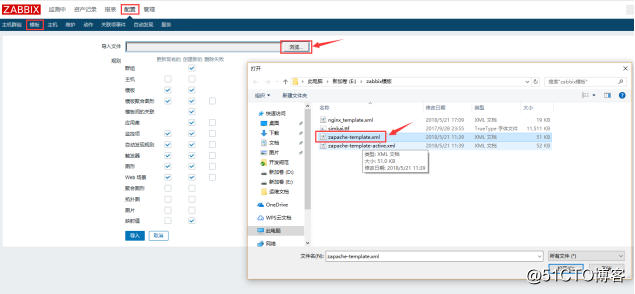
依次将zapache-template.xml和zapache-template-active.xml两个模板文件都导入进来。
4.4.主机添加监控模板
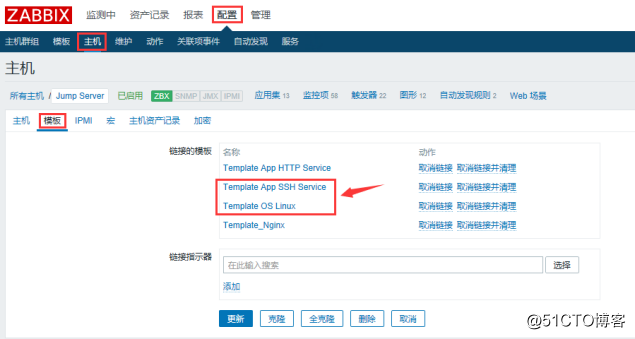
配置-主机,点击要添加的主机,点击“模板”,点击“选择”,勾选
Template App Apache Web Server zapache,然后点击“添加”,最后点击“更新”。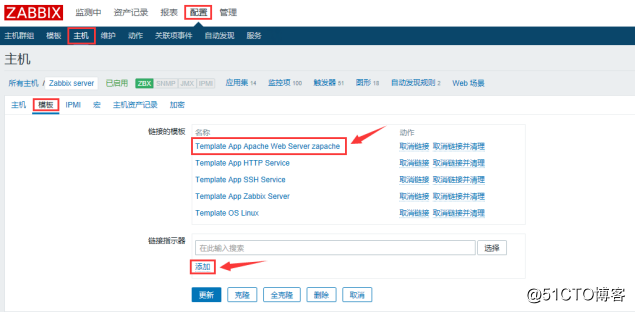
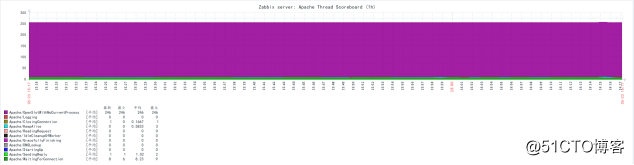
4.5.监控效果图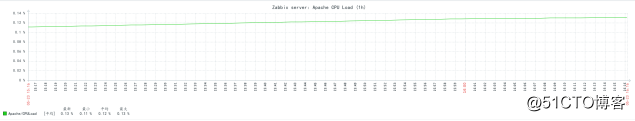
五、监控nginx状态
5.1.启用nginx的status功能$ vim /etc/nginx/nginx.conf
#编辑nginx.conf文件添加如下内容
location /nginx-status {
            stub_status on;
            access_log off;
            allow 127.0.0.1;
            allow 192.168.2.204;   # nginx主机IP
}#使配置生效$ /usr/sbin/nginx -t
$ /usr/sbin/nginx -s reload
用curl来进行测试,此操作请在zabbix-server主机上操作。$ curl http://192.168.2.204/nginx-status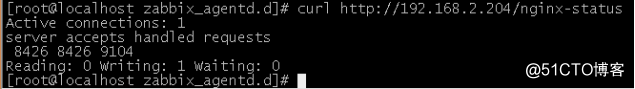
备注:
Active connections –当前活跃的连接数量
server accepts handled requests — 总共处理了8426个连接 , 成功创建 8426次握手, 总共处理了9104个请求
reading — 读取客户端的连接数.
writing — 响应数据到客户端的数量
waiting — 开启 keep-alive 的情况下,这个值等于 active – (reading+writing), 意思就是 Nginx 已经处理完正在等候下一次请求指令的驻留连接
5.2.创建监控脚本$ vim /etc/zabbix/zabbix_agentd.d/nginx_status.sh
#!/bin/bash
##################################
# Zabbix monitoring script
#
# nginx:
# - anything available via nginx stub-status module
#
##################################
# Contact:
# vincent.viallet@gmail.com
# Zabbix requested parameter
ZBX_REQ_DATA="$1"
ZBX_REQ_DATA_URL="$2"
# Nginx defaults
NGINX_STATUS_DEFAULT_URL="192.168.2.204/nginx-status"    #(这里写网站的域名)
WGET_BIN="/usr/bin/wget"
#
# Error handling:
# - need to be displayable in Zabbix (avoid NOT_SUPPORTED)
# - items need to be of type "float" (allow negative + float)
#
ERROR_NO_ACCESS_FILE="-0.9900"
ERROR_NO_ACCESS="-0.9901"
ERROR_WRONG_PARAM="-0.9902"
ERROR_DATA="-0.9903" # either can not connect / bad host / bad port
# Handle host and port if non-default
if [ ! -z "$ZBX_REQ_DATA_URL" ]; then
 URL="$ZBX_REQ_DATA_URL"
else
 URL="$NGINX_STATUS_DEFAULT_URL"
fi
# save the nginx stats in a variable for future parsing
NGINX_STATS=$($WGET_BIN -q $URL -O - 2> /dev/null)
# error during retrieve
if [ $? -ne 0 -o -z "$NGINX_STATS" ]; then
 echo $ERROR_DATA
 exit 1
fi
#
# Extract data from nginx stats
#
case $ZBX_REQ_DATA in
 active_connections) echo "$NGINX_STATS" | head -1 | cut -f3 -d‘ ‘;;
 accepted_connections) echo "$NGINX_STATS" | grep -Ev ‘[a-zA-Z]‘ | cut -f2 -d‘ ‘;;
 handled_connections) echo "$NGINX_STATS" | grep -Ev ‘[a-zA-Z]‘ | cut -f3 -d‘ ‘;;
 handled_requests) echo "$NGINX_STATS" | grep -Ev ‘[a-zA-Z]‘ | cut -f4 -d‘ ‘;;
 reading) echo "$NGINX_STATS" | tail -1 | cut -f2 -d‘ ‘;;
 writing) echo "$NGINX_STATS" | tail -1 | cut -f4 -d‘ ‘;;
 waiting) echo "$NGINX_STATS" | tail -1 | cut -f6 -d‘ ‘;;
 *) echo $ERROR_WRONG_PARAM; exit 1;;
esac
exit 0给此脚本添加可执行权限$ chmod +x /etc/zabbix/zabbix_agentd.d/nginx_status.sh
5.3.配置zabbix-agent$ vim /etc/zabbix/zabbix_agentd.conf
#编辑zabbix_agentd.conf文件,添加下面一行
UserParameter=nginx[*],/etc/zabbix/zabbix_agentd.d/nginx_status.sh "$1"
#重启zabbix-agent$ systemctl restart zabbix-agent
#在zabbix-server主机上测试,不报错说明测试OK$ zabbix_get -s 192.168.2.204 -p 10050 -k ‘nginx[reading]‘
5.4.Web端导入模板
配置-模板-导入,将nginx_template.xml导入进来。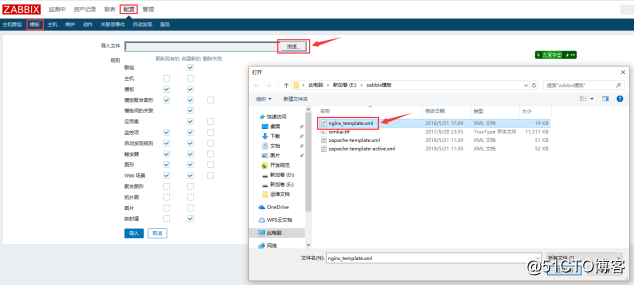
5.5.主机添加监控模板
配置-主机-模板,添加Template_Nginx模板。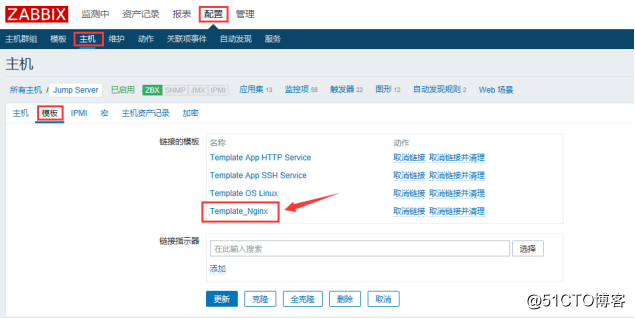
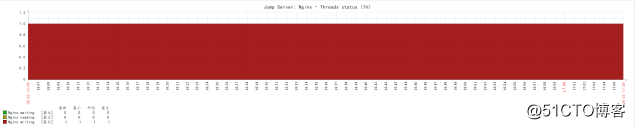
5.6.监控效果图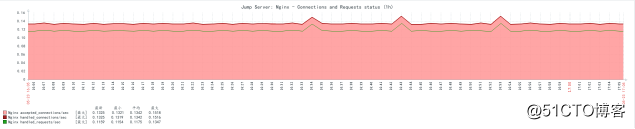
附:nginx模板
<?xml version="1.0" encoding="UTF-8"?>
<zabbix_export>
<version>2.0</version>
<date>2013-03-26T04:17:58Z</date>
<groups>
<group>
<name>Templates</name>
</group>
</groups>
<templates>
<template>
<template>Template_Nginx</template>
<name>Template_Nginx</name>
<groups>
<group>
<name>Templates</name>
</group>
</groups>
<applications>
<application>
<name>Nginx</name>
</application>
</applications>
<items>
<item>
<name>Nginx $1</name>
<type>0</type>
<snmp_community/>
<multiplier>0</multiplier>
<snmp_oid/>
<key>nginx[waiting,{$NGINX_STATUS_URL}]</key>
<delay>60</delay>
<history>30</history>
<trends>365</trends>
<status>0</status>
<value_type>0</value_type>
<allowed_hosts/>
<units/>
<delta>0</delta>
<snmpv3_securityname/>
<snmpv3_securitylevel>0</snmpv3_securitylevel>
<snmpv3_authpassphrase/>
<snmpv3_privpassphrase/>
<formula>1</formula>
<delay_flex/>
<params/>
<ipmi_sensor/>
<data_type>0</data_type>
<authtype>0</authtype>
<username/>
<password/>
<publickey/>
<privatekey/>
<port/>
<description/>
<inventory_link>0</inventory_link>
<applications>
<application>
<name>Nginx</name>
</application>
</applications>
<valuemap/>
</item>
<item>
<name>Nginx $1</name>
<type>0</type>
<snmp_community/>
<multiplier>0</multiplier>
<snmp_oid/>
<key>nginx[writing,{$NGINX_STATUS_URL}]</key>
<delay>60</delay>
<history>30</history>
<trends>365</trends>
<status>0</status>
<value_type>0</value_type>
<allowed_hosts/>
<units/>
<delta>0</delta>
<snmpv3_securityname/>
<snmpv3_securitylevel>0</snmpv3_securitylevel>
<snmpv3_authpassphrase/>
<snmpv3_privpassphrase/>
<formula>1</formula>
<delay_flex/>
<params/>
<ipmi_sensor/>
<data_type>0</data_type>
<authtype>0</authtype>
<username/>
<password/>
<publickey/>
<privatekey/>
<port/>
<description/>
<inventory_link>0</inventory_link>
<applications>
<application>
<name>Nginx</name>
</application>
</applications>
<valuemap/>
</item>
<item>
<name>Nginx $1</name>
<type>0</type>
<snmp_community/>
<multiplier>0</multiplier>
<snmp_oid/>
<key>nginx[active_connections,{$NGINX_STATUS_URL}]</key>
<delay>60</delay>
<history>30</history>
<trends>365</trends>
<status>0</status>
<value_type>0</value_type>
<allowed_hosts/>
<units/>
<delta>0</delta>
<snmpv3_securityname/>
<snmpv3_securitylevel>0</snmpv3_securitylevel>
<snmpv3_authpassphrase/>
<snmpv3_privpassphrase/>
<formula>1</formula>
<delay_flex/>
<params/>
<ipmi_sensor/>
<data_type>0</data_type>
<authtype>0</authtype>
<username/>
<password/>
<publickey/>
<privatekey/>
<port/>
<description/>
<inventory_link>0</inventory_link>
<applications>
<application>
<name>Nginx</name>
</application>
</applications>
<valuemap/>
</item>
<item>
<name>Nginx $1</name>
<type>0</type>
<snmp_community/>
<multiplier>0</multiplier>
<snmp_oid/>
<key>nginx[reading,{$NGINX_STATUS_URL}]</key>
<delay>60</delay>
<history>30</history>
<trends>365</trends>
<status>0</status>
<value_type>0</value_type>
<allowed_hosts/>
<units/>
<delta>0</delta>
<snmpv3_securityname/>
<snmpv3_securitylevel>0</snmpv3_securitylevel>
<snmpv3_authpassphrase/>
<snmpv3_privpassphrase/>
<formula>1</formula>
<delay_flex/>
<params/>
<ipmi_sensor/>
<data_type>0</data_type>
<authtype>0</authtype>
<username/>
<password/>
<publickey/>
<privatekey/>
<port/>
<description/>
<inventory_link>0</inventory_link>
<applications>
<application>
<name>Nginx</name>
</application>
</applications>
<valuemap/>
</item>
<item>
<name>Nginx $1/sec</name>
<type>0</type>
<snmp_community/>
<multiplier>0</multiplier>
<snmp_oid/>
<key>nginx[handled_requests,{$NGINX_STATUS_URL}]</key>
<delay>60</delay>
<history>30</history>
<trends>365</trends>
<status>0</status>
<value_type>0</value_type>
<allowed_hosts/>
<units/>
<delta>1</delta>
<snmpv3_securityname/>
<snmpv3_securitylevel>0</snmpv3_securitylevel>
<snmpv3_authpassphrase/>
<snmpv3_privpassphrase/>
<formula>1</formula>
<delay_flex/>
<params/>
<ipmi_sensor/>
<data_type>0</data_type>
<authtype>0</authtype>
<username/>
<password/>
<publickey/>
<privatekey/>
<port/>
<description/>
<inventory_link>0</inventory_link>
<applications>
<application>
<name>Nginx</name>
</application>
</applications>
<valuemap/>
</item>
<item>
<name>Nginx $1/sec</name>
<type>0</type>
<snmp_community/>
<multiplier>0</multiplier>
<snmp_oid/>
<key>nginx[accepted_connections,{$NGINX_STATUS_URL}]</key>
<delay>60</delay>
<history>30</history>
<trends>365</trends>
<status>0</status>
<value_type>0</value_type>
<allowed_hosts/>
<units/>
<delta>1</delta>
<snmpv3_securityname/>
<snmpv3_securitylevel>0</snmpv3_securitylevel>
<snmpv3_authpassphrase/>
<snmpv3_privpassphrase/>
<formula>1</formula>
<delay_flex/>
<params/>
<ipmi_sensor/>
<data_type>0</data_type>
<authtype>0</authtype>
<username/>
<password/>
<publickey/>
<privatekey/>
<port/>
<description/>
<inventory_link>0</inventory_link>
<applications>
<application>
<name>Nginx</name>
</application>
</applications>
<valuemap/>
</item>
<item>
<name>Nginx $1/sec</name>
<type>0</type>
<snmp_community/>
<multiplier>0</multiplier>
<snmp_oid/>
<key>nginx[handled_connections,{$NGINX_STATUS_URL}]</key>
<delay>60</delay>
<history>30</history>
<trends>365</trends>
<status>0</status>
<value_type>0</value_type>
<allowed_hosts/>
<units/>
<delta>1</delta>
<snmpv3_securityname/>
<snmpv3_securitylevel>0</snmpv3_securitylevel>
<snmpv3_authpassphrase/>
<snmpv3_privpassphrase/>
<formula>1</formula>
<delay_flex/>
<params/>
<ipmi_sensor/>
<data_type>0</data_type>
<authtype>0</authtype>
<username/>
<password/>
<publickey/>
<privatekey/>
<port/>
<description/>
<inventory_link>0</inventory_link>
<applications>
<application>
<name>Nginx</name>
</application>
</applications>
<valuemap/>
</item>
<item>
<name>Number of $1 process</name>
<type>0</type>
<snmp_community>public</snmp_community>
<multiplier>0</multiplier>
<snmp_oid>interfaces.ifTable.ifEntry.ifInOctets.1</snmp_oid>
<key>proc.num[nginx]</key>
<delay>300</delay>
<history>30</history>
<trends>365</trends>
<status>0</status>
<value_type>3</value_type>
<allowed_hosts/>
<units/>
<delta>0</delta>
<snmpv3_securityname/>
<snmpv3_securitylevel>0</snmpv3_securitylevel>
<snmpv3_authpassphrase/>
<snmpv3_privpassphrase/>
<formula>1</formula>
<delay_flex/>
<params/>
<ipmi_sensor/>
<data_type>0</data_type>
<authtype>0</authtype>
<username/>
<password/>
<publickey/>
<privatekey/>
<port/>
<description/>
<inventory_link>0</inventory_link>
<applications/>
<valuemap/>
</item>
</items>
<discovery_rules/>
<macros>
<macro>
<macro>{$NGINX_STATUS_URL}</macro>
<value>http://127.0.0.1:10061/nginx_status</value>
</macro>
</macros>
<templates/>
<screens/>
</template>
</templates>
<triggers>
<trigger>
<expression>{Template_Nginx:proc.num[nginx].last(0)}=0</expression>
<name>Nginx is not running on {HOSTNAME}</name>
<url/>
<status>0</status>
<priority>4</priority>
<description>Nginx is not running.
It has been stopped / shutdown or has crashed.
Check on the server for more details:
- w / last
- dmesg logs
- /var/log/messages
- nginx error logs</description>
<type>0</type>
<dependencies/>
</trigger>
</triggers>
<graphs>
<graph>
<name>Nginx - Connections and Requests status</name>
<width>900</width>
<height>200</height>
<yaxismin>0.0000</yaxismin>
<yaxismax>100.0000</yaxismax>
<show_work_period>0</show_work_period>
<show_triggers>0</show_triggers>
<type>0</type>
<show_legend>1</show_legend>
<show_3d>0</show_3d>
<percent_left>0.0000</percent_left>
<percent_right>0.0000</percent_right>
<ymin_type_1>1</ymin_type_1>
<ymax_type_1>0</ymax_type_1>
<ymin_item_1>0</ymin_item_1>
<ymax_item_1>0</ymax_item_1>
<graph_items>
<graph_item>
<sortorder>0</sortorder>
<drawtype>1</drawtype>
<color>FF9999</color>
<yaxisside>0</yaxisside>
<calc_fnc>4</calc_fnc>
<type>0</type>
<item>
<host>Template_Nginx</host>
<key>nginx[accepted_connections,{$NGINX_STATUS_URL}]</key>
</item>
</graph_item>
<graph_item>
<sortorder>1</sortorder>
<drawtype>2</drawtype>
<color>990000</color>
<yaxisside>0</yaxisside>
<calc_fnc>4</calc_fnc>
<type>0</type>
<item>
<host>Template_Nginx</host>
<key>nginx[handled_connections,{$NGINX_STATUS_URL}]</key>
</item>
</graph_item>
<graph_item>
<sortorder>2</sortorder>
<drawtype>0</drawtype>
<color>009900</color>
<yaxisside>0</yaxisside>
<calc_fnc>4</calc_fnc>
<type>0</type>
<item>
<host>Template_Nginx</host>
<key>nginx[handled_requests,{$NGINX_STATUS_URL}]</key>
</item>
</graph_item>
</graph_items>
</graph>
<graph>
<name>Nginx - Threads status</name>
<width>900</width>
<height>200</height>
<yaxismin>0.0000</yaxismin>
<yaxismax>100.0000</yaxismax>
<show_work_period>0</show_work_period>
<show_triggers>0</show_triggers>
<type>1</type>
<show_legend>1</show_legend>
<show_3d>0</show_3d>
<percent_left>0.0000</percent_left>
<percent_right>0.0000</percent_right>
<ymin_type_1>1</ymin_type_1>
<ymax_type_1>0</ymax_type_1>
<ymin_item_1>0</ymin_item_1>
<ymax_item_1>0</ymax_item_1>
<graph_items>
<graph_item>
<sortorder>0</sortorder>
<drawtype>1</drawtype>
<color>990000</color>
<yaxisside>0</yaxisside>
<calc_fnc>4</calc_fnc>
<type>0</type>
<item>
<host>Template_Nginx</host>
<key>nginx[writing,{$NGINX_STATUS_URL}]</key>
</item>
</graph_item>
<graph_item>
<sortorder>1</sortorder>
<drawtype>1</drawtype>
<color>999900</color>
<yaxisside>0</yaxisside>
<calc_fnc>4</calc_fnc>
<type>0</type>
<item>
<host>Template_Nginx</host>
<key>nginx[reading,{$NGINX_STATUS_URL}]</key>
</item>
</graph_item>
<graph_item>
<sortorder>2</sortorder>
<drawtype>1</drawtype>
<color>009900</color>
<yaxisside>0</yaxisside>
<calc_fnc>4</calc_fnc>
<type>0</type>
<item>
<host>Template_Nginx</host>
<key>nginx[waiting,{$NGINX_STATUS_URL}]</key>
</item>
</graph_item>
</graph_items>
</graph>
</graphs>
</zabbix_export>原文:http://blog.51cto.com/andyxu/2120362