来源:https://blog.csdn.net/david_jiahuan/article/details/80096922
案例一
项目中现有样式:
客户需求:将图例分为两列,并且上下两列的图例要对齐:
==================================================
具体思路:将原有的一个 legend,分成7个小 legend 显示(形容的可能不太形象,下面看代码吧):
(1)原先的代码:
(2)修改后的代码:
==========关键点就是每个小legend的x和y的值!定好每个小legend所在的绝对位置!
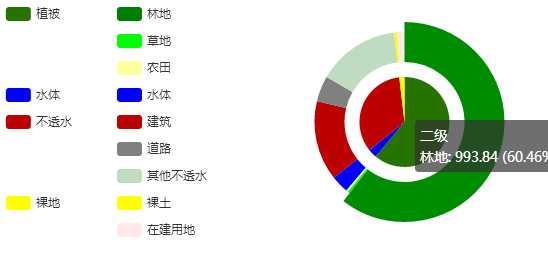
案例二
1效果图
2)代码
//饼图二级
function RowOnClickPieShow2(rowPieA) {
//一级数据
var rowPie = {};
//二级数据
var rowPie2 = {};
if (rowPieA.区域) {
var pieLevel = 0;
if (Level==1) {
pieLevel = 2;
}else if(Level==2){
pieLevel = 1;
}
var url = "@Url.Action("LandscapePie")";
$.post(url, { regionName: rowPieA.区域, level: pieLevel, year: YearSelect }, function (result) {
// console.log(result)
for (var i = 0; i < result.length; i++) {
var obj = result[i];
if (obj.FactorLevel == 1) {
for (var j = 1; j < className.length; j++) {
if (obj.ClassName == className[j]) {
rowPie[obj.ClassName] = obj.Area.toFixed(2);
}
}
} else if (obj.FactorLevel == 2) {
for (var k = 1; k < className2.length; k++) {
if (obj.ClassName == className2[k]) {
rowPie2[obj.ClassName] = obj.Area.toFixed(2);
}
}
}
}
//console.log(rowPie);
//console.log(rowPie2);
var option1 = {
title: {
text: YearSelect + ‘年‘ + rowPieA.区域 + ‘景观要素类型面积统计饼图‘,
//subtext: ‘纯属虚构‘,
x: ‘center‘,
},
tooltip: {
trigger: ‘item‘,
formatter: "{a} <br/>{b}: {c} ({d}%)"
},
legend: [
{
orient: ‘horizontal‘,
x: ‘1%‘,
y: ‘10%‘,
align: ‘left‘,
data: [‘植被‘],
},
{
orient: ‘horizontal‘,
x: ‘20%‘,
y: ‘10%‘,
align: ‘left‘,
data: [‘林地‘],
},
{
orient: ‘horizontal‘,
x: ‘20%‘,
y: ‘19%‘,
align: ‘left‘,
data: [‘草地‘],
},
{
orient: ‘horizontal‘,
x: ‘20%‘,
y: ‘28%‘,
align: ‘left‘,
data: [‘农田‘],
},
{
orient: ‘horizontal‘,
x: ‘1%‘,
y: ‘37%‘,
align: ‘left‘,
data: [‘水体‘],
},
{
orient: ‘horizontal‘,
x: ‘20%‘,
y: ‘37%‘,
align: ‘left‘,
data: [‘水体‘],
},
{
orient: ‘horizontal‘,
x: ‘1%‘,
y: ‘46%‘,
align: ‘left‘,
data: [‘不透水‘],
},
{
orient: ‘horizontal‘,
x: ‘20%‘,
y: ‘46%‘,
align: ‘left‘,
data: [‘建筑‘],
},
{
orient: ‘horizontal‘,
x: ‘20%‘,
y: ‘55%‘,
align: ‘left‘,
data: [‘道路‘],
},
{
orient: ‘horizontal‘,
x: ‘20%‘,
y: ‘64%‘,
align: ‘left‘,
data: [‘其他不透水‘],
},
{
orient: ‘horizontal‘,
x: ‘1%‘,
y: ‘73%‘,
align: ‘left‘,
data: [‘裸地‘],
},
{
orient: ‘horizontal‘,
x: ‘20%‘,
y: ‘73%‘,
align: ‘left‘,
data: [‘裸土‘],
},
{
orient: ‘horizontal‘,
x: ‘20%‘,
y: ‘82%‘,
align: ‘left‘,
data: [‘在建用地‘],
}
] ,
series: [
{
name: ‘一级‘,
type: ‘pie‘,
center: [‘70%‘, ‘50%‘],
radius: [0, ‘30%‘],
label: {
normal: {
show: false,
}
},
data: [
{ value: rowPie.植被, name: ‘植被‘, itemStyle: { normal: { color: ‘rgb(38,115,0)‘ } } },
{ value: rowPie.水体, name: ‘水体‘, itemStyle: { normal: { color: ‘rgb(0,0,255)‘ } } },
{ value: rowPie.不透水, name: ‘不透水‘, itemStyle: { normal: { color: ‘rgb(189,0,0)‘ } } },
{ value: rowPie.裸地, name: ‘裸地‘, itemStyle: { normal: { color: ‘rgb(255,255,0)‘ } } }
]
},
{
name: ‘二级‘,
type: ‘pie‘,
center: [‘70%‘, ‘50%‘],
radius: [‘40%‘, ‘60%‘],
label: {
normal: {
show: false,
}
},
data: [
{ value: rowPie2.林地, name: ‘林地‘, itemStyle: { normal: { color: ‘rgb(0,128,0)‘ } } },
{ value: rowPie2.草地, name: ‘草地‘, itemStyle: { normal: { color: ‘rgb(0,255,0)‘ } } },
{ value: rowPie2.农田, name: ‘农田‘, itemStyle: { normal: { color: ‘rgb(255,255,160)‘ } } },
{ value: rowPie2.水体, name: ‘水体‘, itemStyle: { normal: { color: ‘rgb(0,0,255)‘ } } },
{ value: rowPie2.建筑, name: ‘建筑‘, itemStyle: { normal: { color: ‘rgb(189,0,0)‘ } } },
{ value: rowPie2.道路, name: ‘道路‘, itemStyle: { normal: { color: ‘rgb(128,128,128)‘ } } },
{ value: rowPie2.其他不透水, name: ‘其他不透水‘, itemStyle: { normal: { color: ‘rgb(192,220,192)‘ } } },
{ value: rowPie2.裸土, name: ‘裸土‘, itemStyle: { normal: { color: ‘rgb(255,255,0)‘ } } },
{ value: rowPie2.在建用地, name: ‘在建用地‘, itemStyle: { normal: { color: ‘rgb(255,233,233)‘ } } }
]
}
]
};
//使用指定的配置项和数据显示图表
pie_chart1.setOption(option1,true);
});
}
}
原文:https://www.cnblogs.com/hao-1234-1234/p/9146751.html