https://vivekcek.wordpress.com/tag/tensorboard-windows/
Posted by vivekcek on August 6, 2017
In this post i will show , how you can visualise computational graphs created by tensorflow bu using tensorboard.

I am using visual studio for tensorflow development in windows. Refer my previous blog to setup tensor flow in windows Installing tensorflow in windows
Hope the reader has some basic understanding of tensorflow. Tensorflow execute every operation by building computational graphs. To visualize such graph we use tensorboard.
Tensorboard is a visualisation tool that will be installed as a part of tensorflow installation.
Write below code in visual studio. In this code we declare four constants, then we multiply ‘a’ and b’ after that we divide ‘c’ and ‘d’ then result of both were added to produce the final output.
|
1
2
3
4
5
6
7
8
9
10
11
12
13
14
15
16
17
18
|
import tensorflow as tfa=tf.constant(6,name="a")b=tf.constant(3,name="b")c=tf.constant(10,name="c")d=tf.constant(5,name="d")mul=tf.multiply(a,b,name="mul")div=tf.div(c,d,name="div")addn=tf.add_n([mul,div],name="addn")sess=tf.Session()output =sess.run(addn)print(output)writer=tf.summary.FileWriter(‘./visual‘,sess.graph)writer.close()sess.close() |
These line actually help us to create graphs for above computation. Here “visual” is a folder created in your running directory.
|
1
2
|
writer=tf.summary.FileWriter(‘./visual‘,sess.graph)writer.close() |
Now go to your running directory and execute below command.
|
1
|
tensorboard --logdir="visual" |
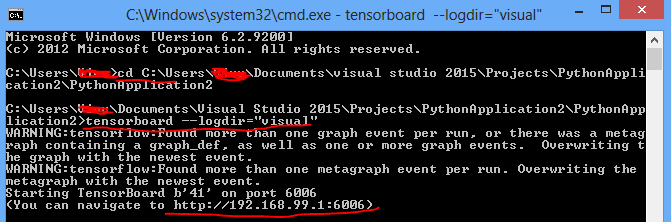
Now browse to the link and see the graph.

原文:https://www.cnblogs.com/wincai/p/9256836.html