plt.subplot2grid
plt.subplot2grid(shape, loc, rowspan=1, colspan=1, fig=None, **kwargs)
shape : sequence of 2 ints
loc : sequence of 2 ints
rowspan : int
Number of rows for the axis to span to the right.
colspan : int
Number of columns for the axis to span downwards.
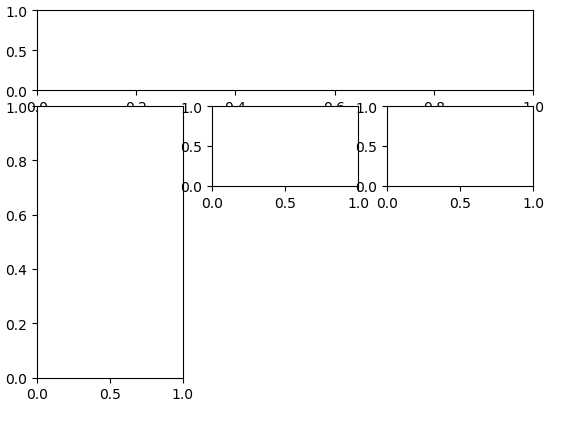
example:
plt.subplot2grid((4, 3), (0, 0), colspan=3)
plt.subplot2grid((4, 3), (1, 0), rowspan=3)
plt.subplot2grid((4, 3), (1, 1))
plt.subplot2grid((4, 3), (1, 2))
plt.subtitle(‘haha‘)
原文:https://www.cnblogs.com/key221/p/9391649.html