#1. 选取数据空间中的K个对象作为初始中心,每个对象代表一个聚类中心
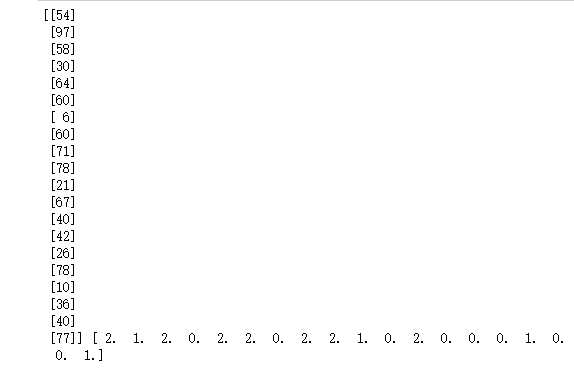
import numpy as np
x=np.random.randint(1,100,[20,1])
x=np.random.randint(1,100,[20,1])
y=np.zeros(20)
k=3
x
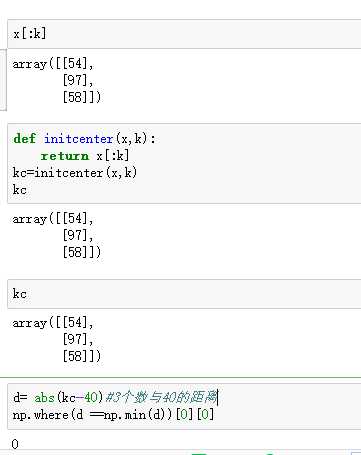
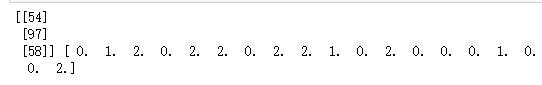
def initcenter(x,k):#初始聚类中心数组
    return x[:k]
def nearest(kc,i):#距离绝对值
    d=(abs(kc-i))
    w=np.where(d==np.min(d))
    return w[0][0]
def xclassify(x,y,kc):
    for i in range(x.shape[0]):#对数组的每个值进行分类
        y[i]=nearest(kc,x[i])
    return y
kc=initcenter(x,k)
y=xclassify(x,y,kc)
print(kc,y)
#计算各聚类新均值
def kcmean(x,y,kc,k):
    l = list(kc)
    flag = False
    for c in range(k):
        print(c)
        m = np.where(y == c)
        n=np.mean(x[m])
        if l[c] != n:
            l[c] = n
 #聚类中心发生变化
            flag = True
            #print(l,flag)
    return (np.array(l),flag)

k = 3
kc = initcenter(x,k)
flag = True
print(x,y,kc,flag)
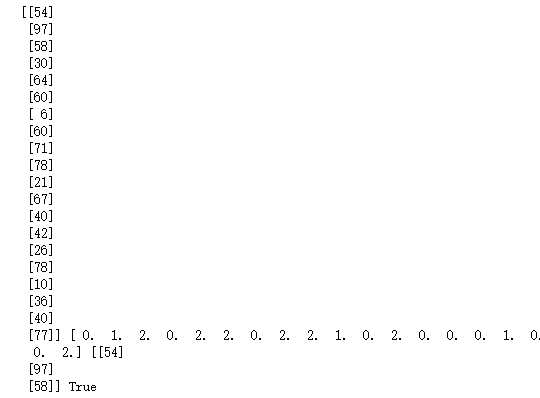
#判断聚类中心和目标函数的值是否发生改变,若不变,则输出结果,若改变,则返回2
while flag:
    y = xclassify(x,y,kc)
    kc, flag = kcmean(x,y,kc,k)
    print(y,kc,type(kc))
print(x,y)
import matplotlib.pyplot as plt
plt.scatter(x,x,c=y,s=50,cmap="rainbow");
plt.show()
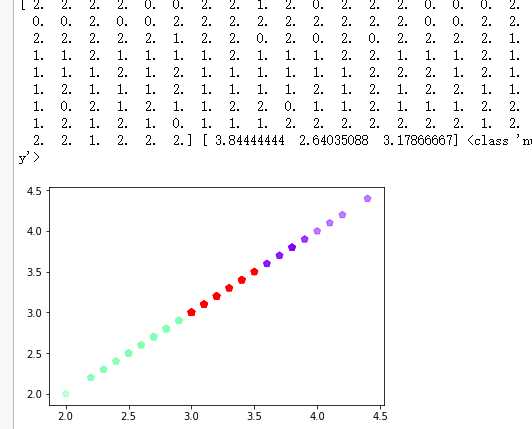
#2. 鸢尾花花瓣长度数据做聚类并用散点图显示
import numpy as np
from sklearn.datasets import load_iris

iris = load_iris()
x = iris.data[:, 1]
y = np.zeros(150)


def initcent(x, k):  # 初始聚类中心数组
    return x[0:k].reshape(k)


def nearest(kc, i):  # 数组中的值,与聚类中心最小距离所在类别的索引号
    d = (abs(kc - i))
    w = np.where(d == np.min(d))
    return w[0][0]


def kcmean(x, y, kc, k):  # 计算各聚类新均值
    l = list(kc)
    flag = False
    for c in range(k):
        m = np.where(y == c)
        n = np.mean(x[m])
        if l[c] != n:
            l[c] = n
            flag = True  # 聚类中心发生变化
    return (np.array(l), flag)


def xclassify(x, y, kc):
    for i in range(x.shape[0]):  # 对数组的每个值分类
        y[i] = nearest(kc, x[i])
    return y

k = 3
kc = initcent(x, k)
flag = True
print(x, y, kc, flag)
while flag:
    y = xclassify(x, y, kc)
    kc, flag = kcmean(x, y, kc, k)
print(y, kc, type(kc))

import matplotlib.pyplot as plt
plt.scatter(x,x,c=y,s=50,cmap=‘rainbow‘,marker=‘p‘,alpha=0.5)
plt.show()
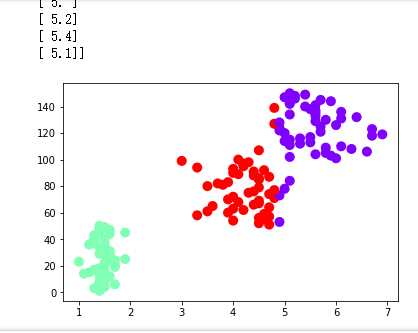
    #3.用sklearn.cluster.KMeans,鸢尾花花瓣长度数据做聚类并用散点图显示
import numpy as np
from sklearn.cluster import KMeans
from sklearn.datasets import load_iris
import matplotlib.pyplot as plt

iris_data = load_iris()
X=iris_data.data

petal_length = X[:, 2:3]
x= petal_length
print(x)
k_means = KMeans(n_clusters=3)
est = k_means.fit(x)
kc = est.cluster_centers_
y_kmeans = k_means.predict(x)

plt.scatter(x,np.linspace(1,150,150),c=y_kmeans,marker=‘o‘,cmap=‘rainbow‘,linewidths=4)
plt.show()
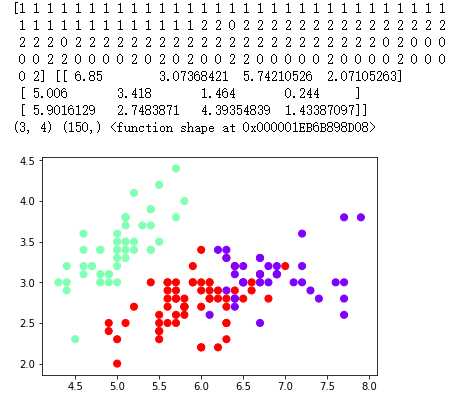
#4. 鸢尾花完整数据做聚类并用散点图显示
import matplotlib.pyplot as plt
import numpy as np
from sklearn.datasets import load_iris

iris = load_iris()
X = iris.data
X

from sklearn.cluster import KMeans

est = KMeans(n_clusters = 3)
est.fit(X)
kc = est.cluster_centers_
y_kmeans = est.predict(X)   #预测每个样本的聚类索引

print(y_kmeans,kc)
print(kc.shape,y_kmeans.shape,np.shape)

plt.scatter(X[:,0],X[:,1],c=y_kmeans,s=50,cmap=‘rainbow‘);
plt.show()
原文:https://www.cnblogs.com/zhanyuki/p/9863697.html