一丶简介
本次说的是前端的可视化的内容,主要就是简单的3D地球的绘制,现在越来越多的插件和脚本涌入互联网,人们开始越来越不用造轮子了。今天我们就是介绍一个好用的可视化插件。echarts(百度出品)。
二丶内容
我是用的python自带的web服务写的,废话不多说,直接贴代码
```
def map():
    print("context-Type: text/html")
    print()
    print("""
?
<!doctype html>
<html>
<head>
<meta charset="gb2312">
<script src="../static/echarts.js"></script>
<script src="../static/echarts-gl.js"></script>
<title>3D地球</title>
<style>
    *{
        margin:0px;
        padding:0px;
    }
</style>
</head>
<body>
<div id="main" style="width:100%; height:100%;"></div>
</body>
<script>
    var main = document.getElementById("main")
    var winheight = window.innerHeight;
    main.style.height = winheight+"px";
</script>
<script type="text/javascript">
    var echart = echarts.init(document.getElementById("main"));
    var option = {
            backgroundColor: ‘#000‘,
            globe: {
                baseTexture: "../static/world-map.jpg",
                heightTexture: "../static/world-map.jpg",
                displacementScale: 0.04,
                shading: ‘realistic‘,
                environment: ‘../static/background.jpg‘,
                realisticMaterial: {
                    roughness: 0.9
                },
                postEffect: {
                    enable: true
                },
                light: {
                    main: {
                        intensity: 5,
                        shadow: true
                    },
                    ambientCubemap: {
                        diffuseIntensity: 0.2
                    }
                }
            }
        };
    echart.setOption(option)
</script>
</html>
        """)
?
?
map()
?```
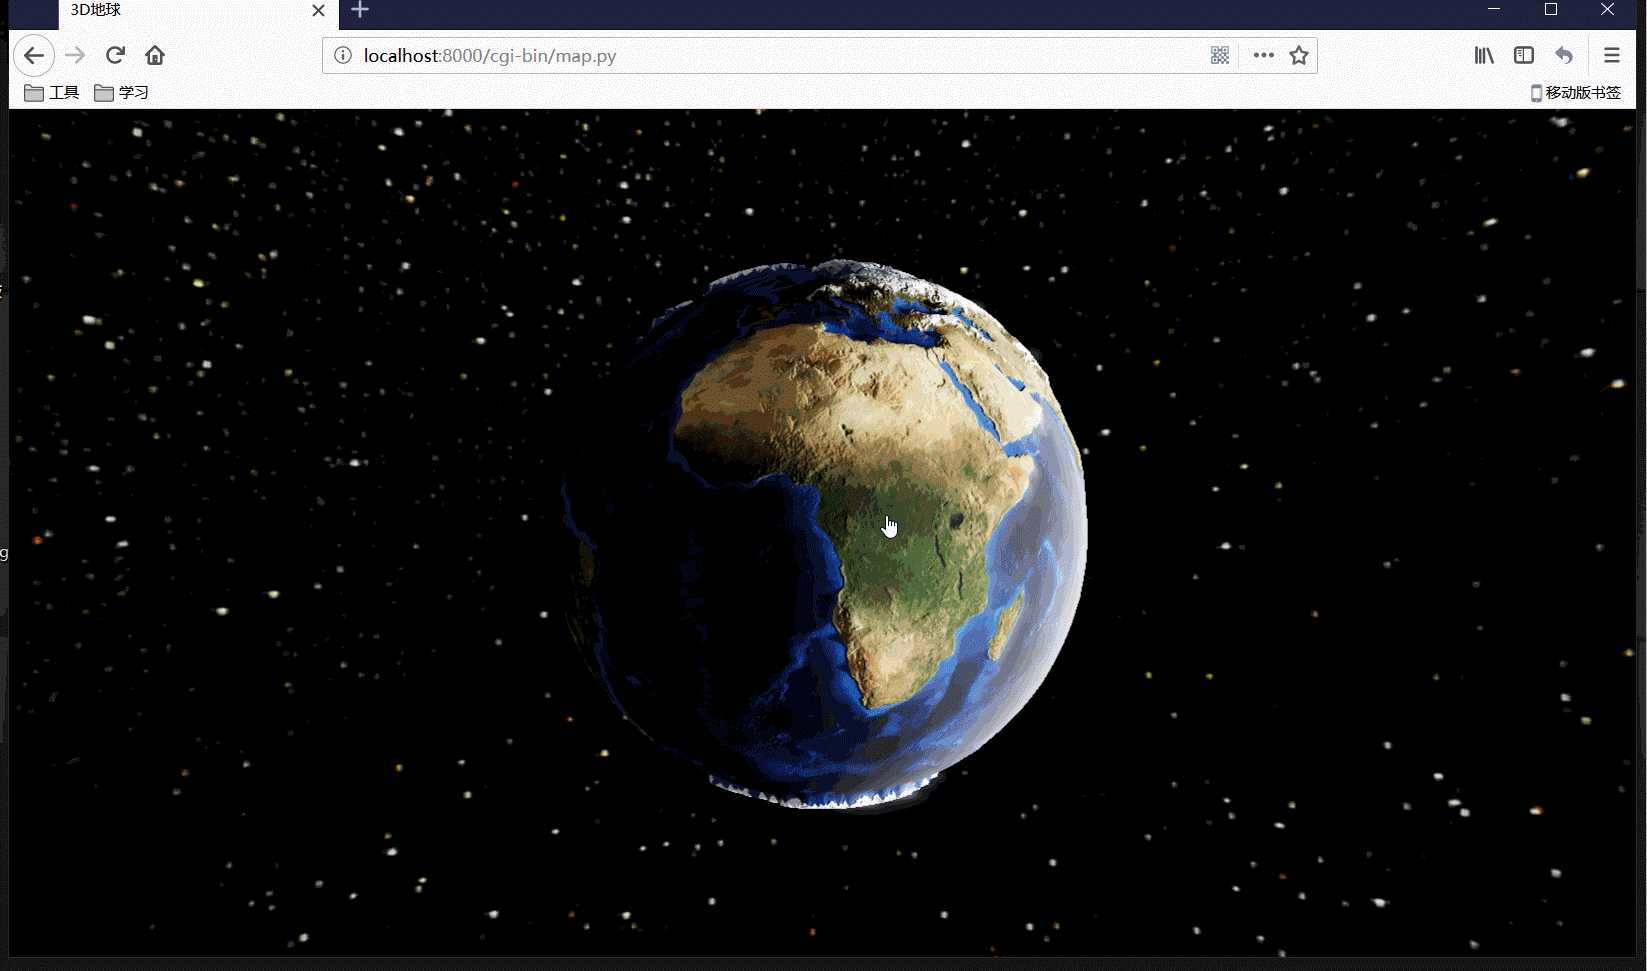
启动python的web服务就可以在浏览器中输入
localhost:8000/cgi-bin/map.py
就可以访问了
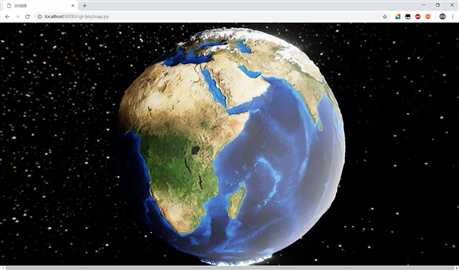
效果图:
需要资料与源码扫描二维码: