1. 打开 eclipse for php IDE,window->preference->PHP->Debug
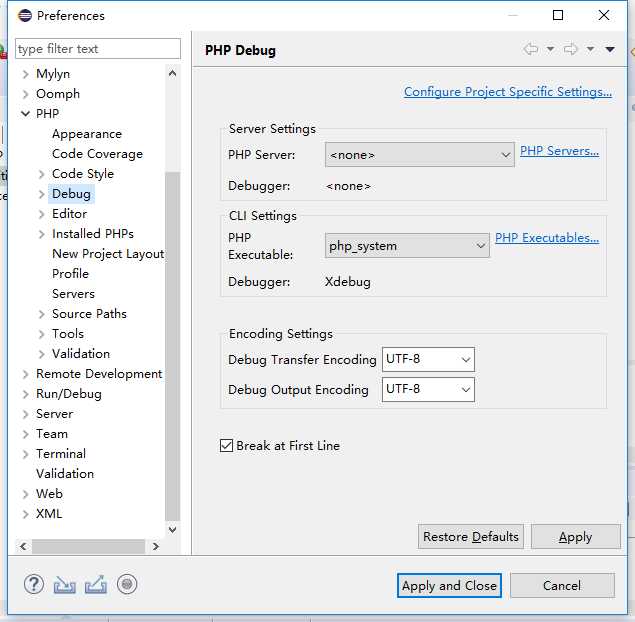
2. 配置phpserver
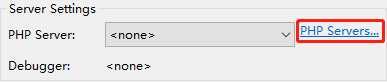
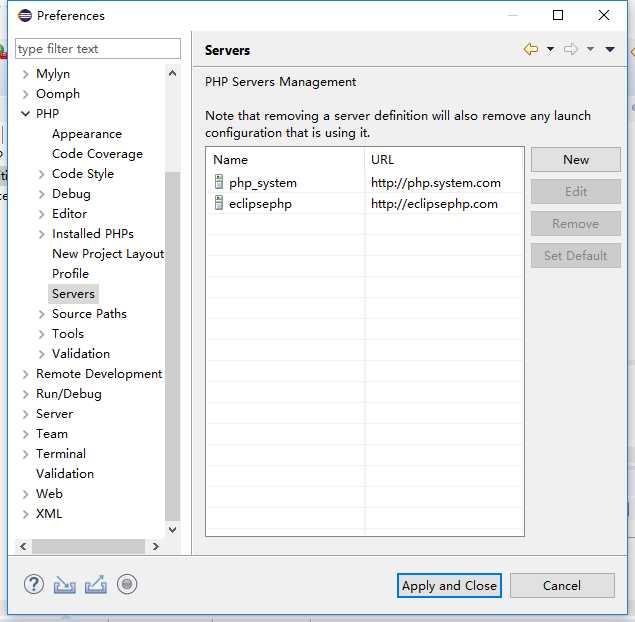
3. 我的已经增加好了,默认的应该有localhost之类的,你只需要点击编辑或者新增就行
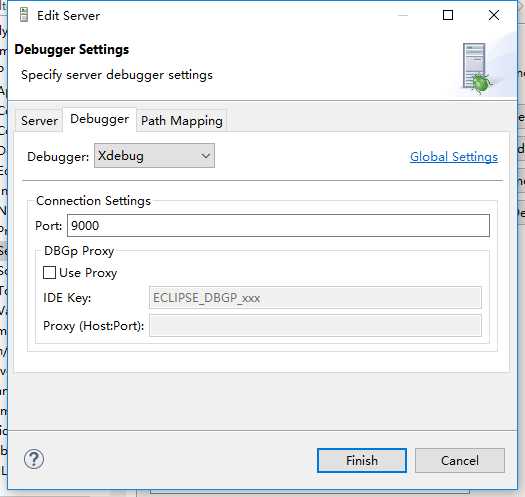
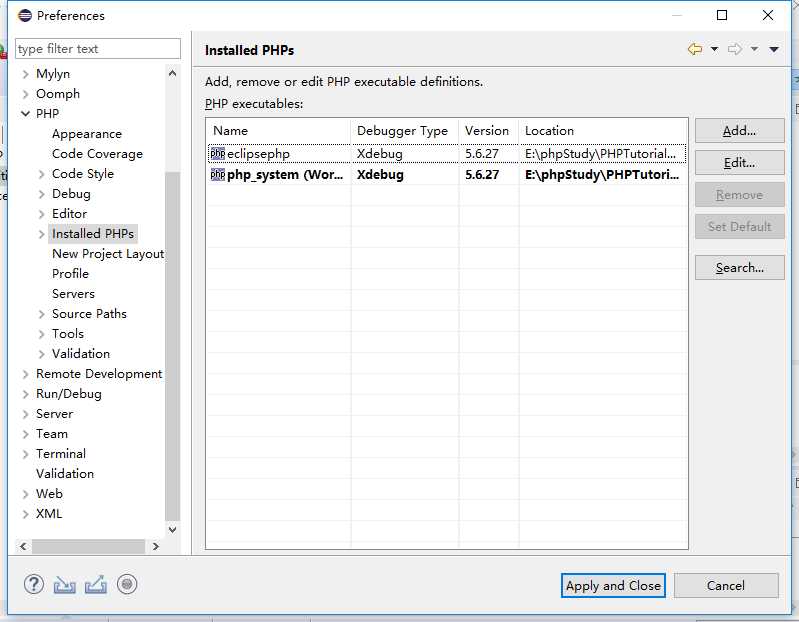
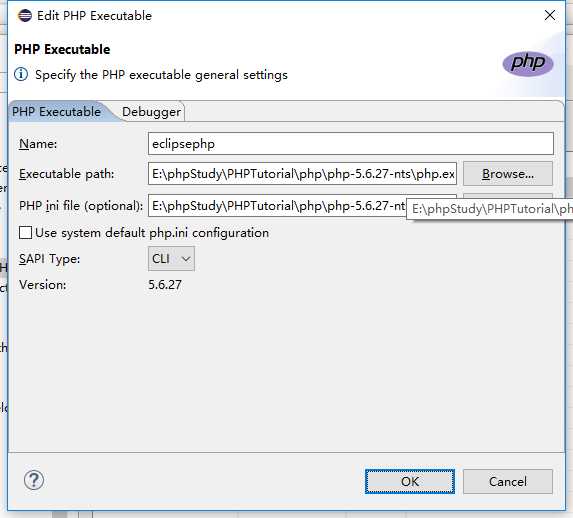
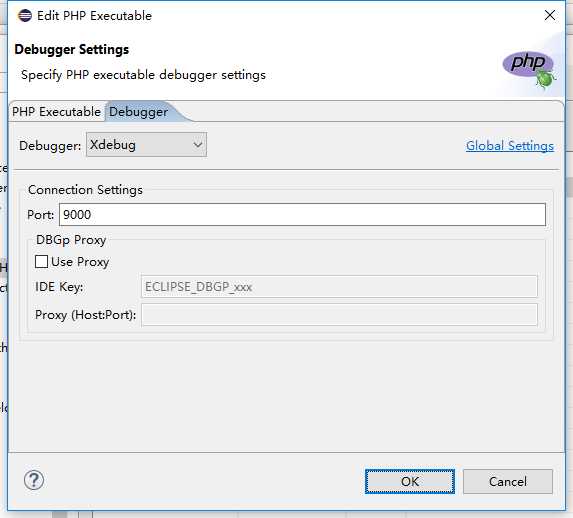
3. 配置PHPExcuteables
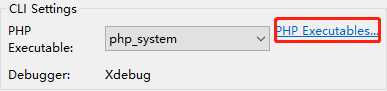
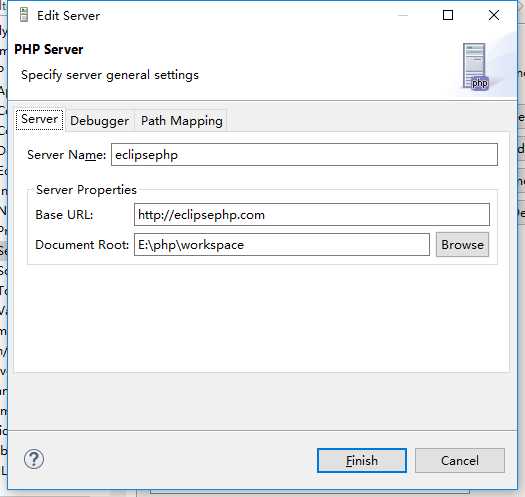
4. 新增或者编辑
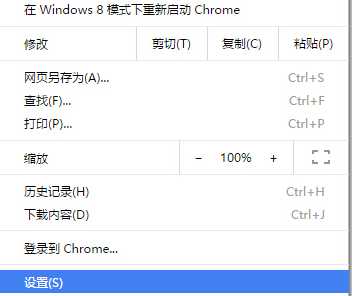
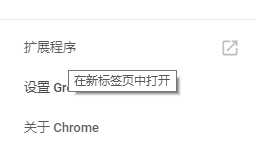
5. 增加浏览器中的xdebug helper,下载谷歌浏览器的xdebug helper插件,然后点击浏览器的工具栏设置
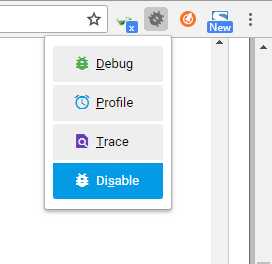
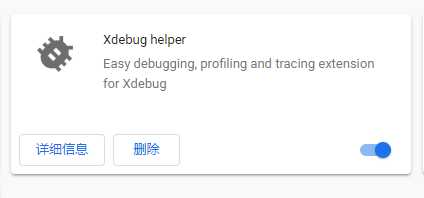
这样就配置好了
6. 新键一个PHP项目
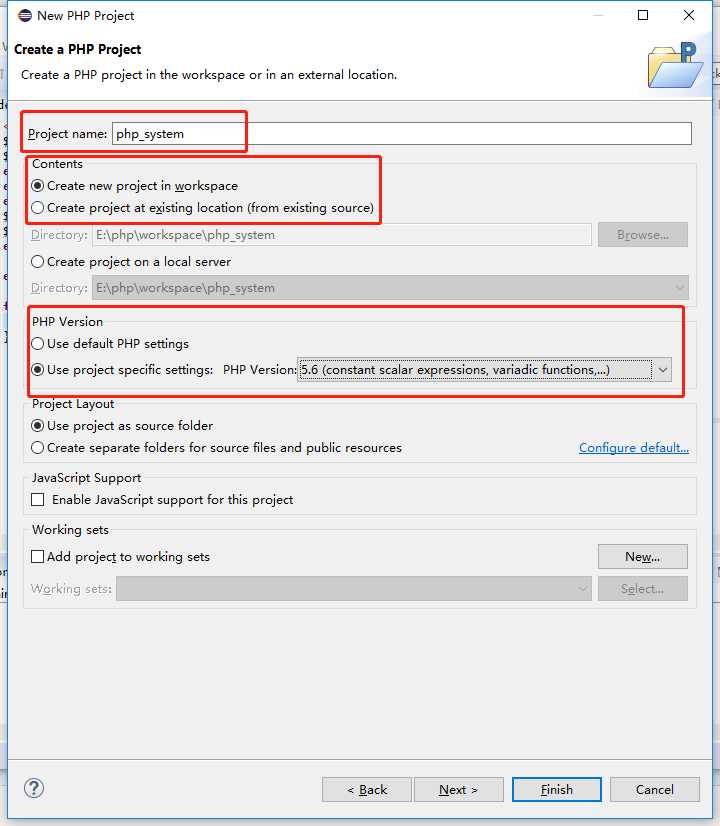
在项目里面建立一个PHP的index.php
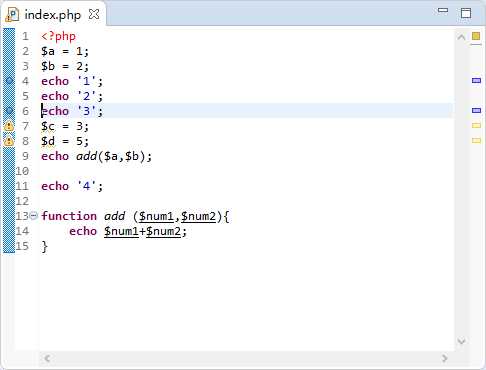
然后通过开启xdebug helper 访问浏览器 http://www.eclipsephp.com/test/index.php eclipse就会出现断点调试信息
最后:请配置php.ini
;xdebug start

[XDebug]
xdebug.profiler_output_dir="E:\phpStudy\PHPTutorial\tmp\xdebug"
xdebug.trace_output_dir="E:\phpStudy\PHPTutorial\tmp\xdebug"
zend_extension="../ext/php_xdebug.dll"

xdebug.remote_enable = On
xdebug.remote_handler = dbgp
;启动性能检测分析
xdebug.profiler_enable = On
;启动代码自动跟踪
xdebug.auto_trace=On
xdebug.profiler_enable_trigger = On
xdebug.profiler_output_name = cachegrind.out.%t.%p
;指定性能分析文件的存放目录
xdebug.profiler_output_dir ="E:/xdebug/tmp"
xdebug.show_local_vars=0
;配置端口和监听的域名
xdebug.remote_port=9000
xdebug.remote_host="localhost"
xdebug.idekey = PHPSTORM

;xdebug end

[zend debug]
这段配置通用于phpstorm,这里需要配置一个 php_xdebug.dll 的插件。
原文:https://www.cnblogs.com/jiangxiaobo/p/10454669.html