MATLAB程序:
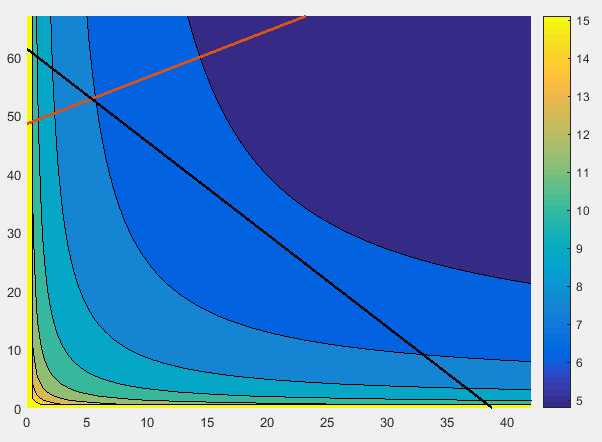
figure
contour(x,y,data) % 画等高线
hold on
plot(x,y(x)) %画线性规划约束方程1
hold on
plot(y,x(y)) %画线性规划约束方程2
小小知识点(四)——MATLAB如何画等高线图和线性规划约束方程
原文:https://www.cnblogs.com/weinapang/p/10583197.html