001 |
/* |
002 |
* Filename: OQtyOrPriceReport.js |
003 |
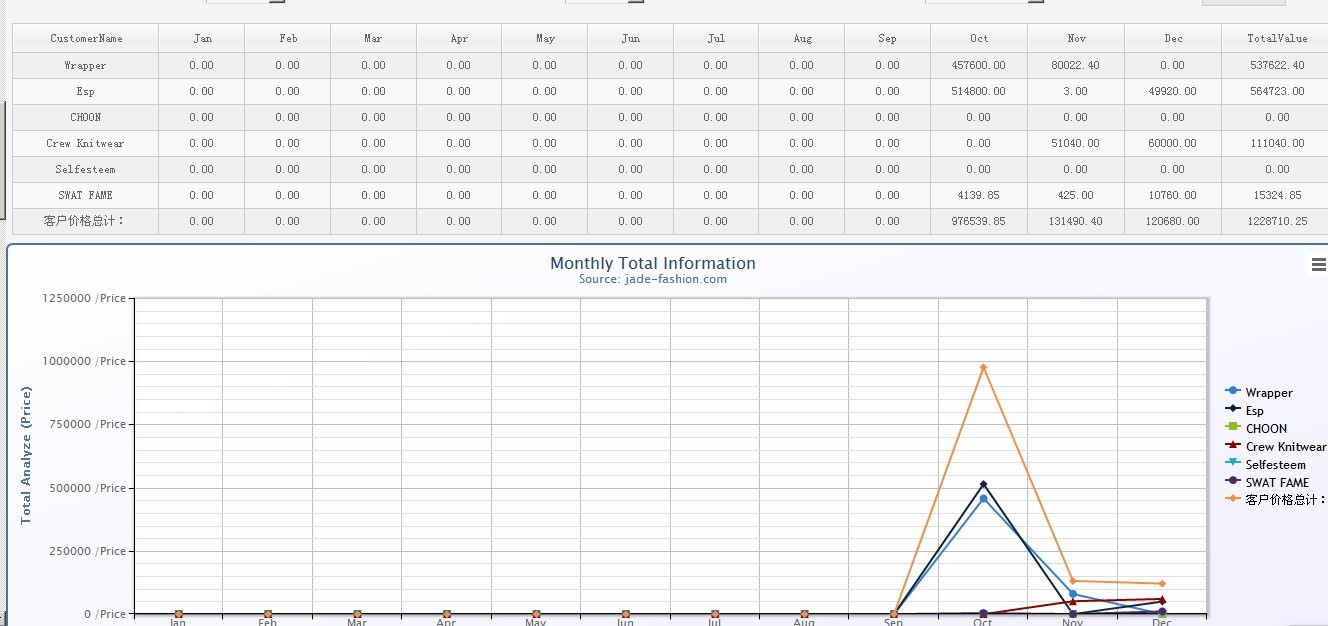
* Description:客户订单数量和价格报表分析 |
004 |
* Created: 2013.11.14 |
005 |
* Author : liangjw |
006 |
* Company:Copyright (C) 2013 Create Family Wealth Power By Peter |
007 |
*/ |
008 |
//////////////////////////////////////////////////////////////////////////////////////////////////// |
009 |
var dataTmp =
""; |
010 |
$(function
() { |
011 |
????GetseriesValue();?
//获取数据源信息 |
012 |
}); |
013 |
? |
014 |
//获取数据源信息 |
015 |
////////////////////////////////////////////////////////////////////// |
016 |
function GetseriesValue() { |
017 |
? |
018 |
????var
DropCustomerName = $("#DropCustomerName").val();?
//获取客户名称 |
019 |
? |
020 |
????$.ajax({ |
021 |
????????type:
"get", |
022 |
????????url:
"/ashx/GetClassTypeJosn.ashx", |
023 |
????????data: { method:
"mlqtylist", DropCustomerName: DropCustomerName }, |
024 |
????????dataType:
"json", |
025 |
????????cache:
false, |
026 |
????????success:
function (result) { |
027 |
????????????dataTmp =
""; |
028 |
????????????$.each(result,
function (i, field) { |
029 |
????????????????//拼接json数据集字符串 |
030 |
????????????????dataTmp +=
"{name: ‘" + field.CustomerName +
"‘,data: [" + field.Jan +
", " + field.Feb + ", "
+ field.Mar + ", "
+ field.Apr |
031 |
????????????????+
", " + field.May +
", " + field.Jun + ","
+ field.Jul + ", "
+ field.Aug + "," + field.Sep +
", " + field.Oct |
032 |
????????????????+
"," + field.Nov + ", "
+ field.Dec + "]}"
+ ","; |
033 |
????????????}); |
034 |
????????????//去除最后一个字符 |
035 |
????????????dataTmp=dataTmp.substring(0, dataTmp.length - 1); |
036 |
????????????GetData(dataTmp); |
037 |
????????}, |
038 |
????????error:
function () { |
039 |
????????????alert("请求超时。请重试!"); |
040 |
????????} |
041 |
????}); |
042 |
}; |
043 |
? |
044 |
//绑定获取数据信息操作 |
045 |
////////////////////////////////////////////////////////////////////// |
046 |
function GetData(dataTmp) { |
047 |
? |
048 |
????//绑定数据信息 |
049 |
????$(‘#container‘).highcharts({ |
050 |
????????chart: { |
051 |
????????????backgroundColor: { |
052 |
????????????????linearGradient: { x1: 0, y1: 0, x2: 1, y2: 1 }, |
053 |
????????????????stops: [ |
054 |
????????????[0,
‘rgb(255, 255, 255)‘], |
055 |
????????????[1,
‘rgb(240, 240, 255)‘] |
056 |
?????????] |
057 |
????????????}, |
058 |
????????????borderWidth: 2, |
059 |
????????????plotBackgroundColor:
‘rgba(255, 255, 255, .9)‘, |
060 |
????????????plotShadow:
true, |
061 |
????????????plotBorderWidth: 1 |
062 |
????????}, |
063 |
????????title: { |
064 |
????????????text:
‘Monthly? Total Information ‘, |
065 |
????????????x: -20 |
066 |
????????}, |
067 |
????????subtitle: { |
068 |
????????????text:
‘Source: winnaodan.net‘, |
069 |
????????????x: -20 |
070 |
????????}, |
071 |
??????????lang: { |
072 |
????????????printChart:
‘打印图表‘, |
073 |
????????????downloadPNG:
‘下载JPEG 图片‘, |
074 |
????????????downloadJPEG:
‘下载JPEG文档‘, |
075 |
????????????downloadPDF:
‘下载PDF 文件‘, |
076 |
????????????downloadSVG:
‘下载SVG 矢量图‘, |
077 |
????????????contextButtonTitle:
‘下载图片‘ |
078 |
????????}, |
079 |
????????xAxis: { |
080 |
????????????gridLineWidth: 1, |
081 |
????????????lineColor:
‘#000‘, |
082 |
????????????tickColor:
‘#000‘, |
083 |
????????????categories: [‘Jan‘,
‘Feb‘, ‘Mar‘,
‘Apr‘, ‘May‘,
‘Jun‘, ‘Jul‘,
‘Aug‘, ‘Sep‘,
‘Oct‘, ‘Nov‘,
‘Dec‘] |
084 |
????????}, |
085 |
????????yAxis: { |
086 |
????????????minorTickInterval:
‘auto‘, |
087 |
????????????lineColor:
‘#000‘, |
088 |
????????????lineWidth: 1, |
089 |
????????????tickWidth: 1, |
090 |
????????????tickColor:
‘#000‘, |
091 |
????????????min: 0, |
092 |
????????????labels: { |
093 |
????????????????formatter:
function () {? //设置纵坐标值的样式 |
094 |
????????????????return
this.value + ‘/Qty‘; |
095 |
????????????????} |
096 |
????????????}, |
097 |
????????????title: { |
098 |
????????????text:
‘Total Analyze? (Qty)‘ |
099 |
????????????}, |
100 |
????????????plotLines: [{ |
101 |
????????????????value: 0, |
102 |
????????????????width: 1, |
103 |
????????????????color:
‘#808080‘ |
104 |
????????????}] |
105 |
????????}, |
106 |
????????tooltip: { |
107 |
????????????formatter:
function () { |
108 |
????????????????return
‘<b>‘ + this.series.name +
‘</b><br/>‘ + this.x +
‘: ‘ + this.y + yAxisLabels; |
109 |
????????????} |
110 |
????????}, |
111 |
????????legend: { |
112 |
????????????itemStyle: { |
113 |
????????????????font:
‘9pt Trebuchet MS, Verdana, sans-serif‘, |
114 |
????????????????color:
‘black‘ |
115 |
????????????}, |
116 |
????????????itemHoverStyle: { |
117 |
????????????????color:
‘#039‘ |
118 |
????????????}, |
119 |
????????????itemHiddenStyle: { |
120 |
????????????????color:
‘gray‘ |
121 |
????????????}, |
122 |
????????????layout:
‘vertical‘, |
123 |
????????????align:
‘right‘, |
124 |
????????????verticalAlign:
‘middle‘, |
125 |
????????????borderWidth: 0 |
126 |
????????}, |
127 |
????????series: eval("["
+ dataTmp + "]")?
//获取数据源操作信息 |
128 |
????}); |
129 |
} |
ajax请求返回Json字符串运用highcharts数据图表展现数据
原文:https://www.cnblogs.com/xfgnongmin/p/10654062.html