最近开发时要实现一个业务逻辑:
最终效果图是这样的:
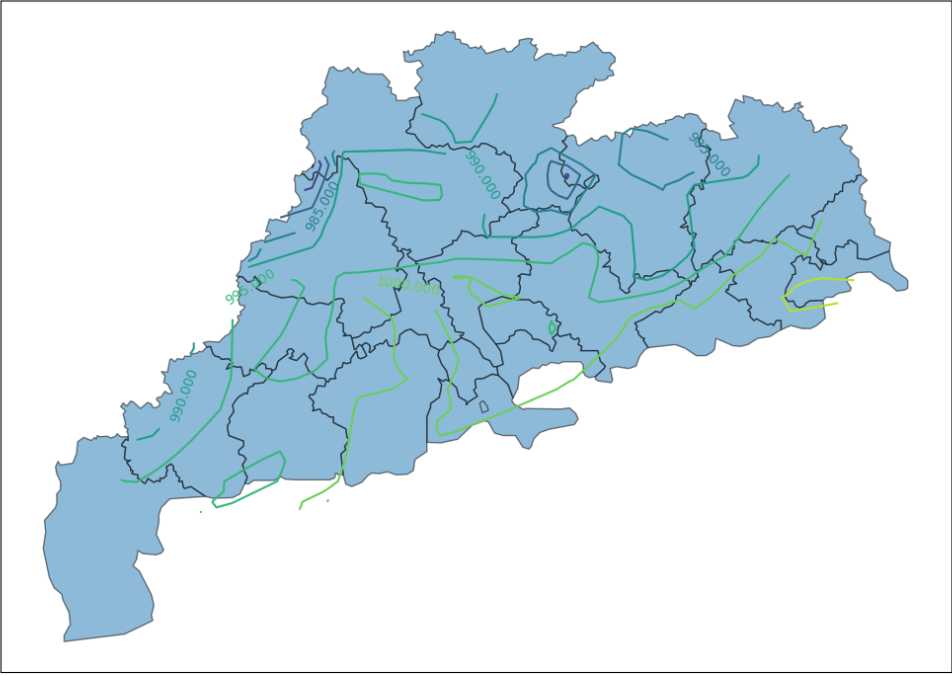
[{Station_Id_C,Year,Mon,Day,Hour,PES}],然后遍历气象站点列表,把对应的经纬度(longitude、latitude)存入数组中,得到了这样的三元组数组(longitude、latitude、value),用pandas处理一下:x = df['longitude'].values
y = df['latitude'].values
z = df[request.GET.get("c")].valuesX , Y = np.meshgrid(x,y)points = [[a, b] for a, b in zip(x, y)]Z = griddata(points, z, (X, Y))df = gpd.read_file(os.path.dirname(__file__) + ‘\\gd.json‘),然后将地图渲染到matplotlib的画布上ax = df.plot(figsize=(10, 10), alpha=0.2, edgecolor=‘k‘)C = ax.contour(X, Y, Z),再标注等压线的数值plt.clabel(C, inline=True, fontsize=10)plt.xticks(()) plt.yticks(()),调用show函数查看图像def get_contour(request):
index_url = "http://api.data.cma.cn:8090/api?"
get_params = {
"dataFormat": "json",
"interfaceId": "getSurfEleByTimeRangeAndStaID",
"dataCode": "SURF_CHN_MUL_HOR",
"timeRange": "[" + datetime.strptime(request.GET.get('f'), "%Y-%m-%dT%H:%M").strftime(
"%Y%m%d%H%M%S") + "," + datetime.strptime(request.GET.get('g'), "%Y-%m-%dT%H:%M").strftime(
"%Y%m%d%H%M%S") + "]",
"staIDs": int(request.GET.get('e')),
"elements": 'Station_Id_C,Year,Mon,Day,Hour,' + request.GET.get("c")
}
session = requests.Session()
f = session.get(index_url + parse.urlencode(get_params))
s = json.loads(f.text)
l = s['DS'][len(s['DS']) - 1]
date = datetime(year=int(l['Year']), month=int(l['Mon']),
day=int(l['Day']), hour=int(l['Hour']))
s = list(DCmaStation.objects.all().values())
d = []
for i in range(int(len(s) / 30) + 1):
n = [j['id'] for j in s[i * 30: (i + 1) * 30]]
get_params = {
"dataFormat": "json",
"interfaceId": "getSurfEleByTimeRangeAndStaID",
"dataCode": "SURF_CHN_MUL_HOR",
"timeRange": "[" + date.strftime("%Y%m%d%H%M%S") + "," + date.strftime("%Y%m%d%H%M%S") + "]",
"staIDs": str(n),
"elements": 'Station_Id_C,Year,Mon,Day,Hour,' + request.GET.get("c")
}
f = session.get(index_url + parse.urlencode(get_params))
d.extend(json.loads(f.text)['DS'])
for i in d:
for j in s:
if int(i['Station_Id_C']) == int(j['id']):
i['longitude'] = j['longitude']
i['latitude'] = j['latitude']
break
df = pd.DataFrame(d)
x = df['longitude'].values
y = df['latitude'].values
z = df[request.GET.get("c")].values
def plot_contour(x, y, z, resolution=50, contour_method='linear'):
resolution = str(resolution) + 'j'
X, Y = np.mgrid[min(x):max(x):complex(resolution), min(y):max(y):complex(resolution)]
points = [[a, b] for a, b in zip(x, y)]
Z = griddata(points, z, (X, Y), method=contour_method)
return X, Y, Z
X, Y, Z = plot_contour(x, y, z, resolution=50, contour_method='linear')
locale.setlocale(locale.LC_CTYPE, 'chinese')
plt.rcParams['font.sans-serif'] = ['SimHei']
df = gpd.read_file(os.path.dirname(__file__) + '\\gd.json')
ax = df.plot(figsize=(10, 10), alpha=0.2, edgecolor='k')
C = ax.contour(X, Y, Z)
plt.clabel(C, inline=True, fontsize=10)
plt.xticks(())
plt.yticks(())
plt.title(
"广东省" + date.strftime("%Y年%m月%d日%H时") + "等" + DCmaDict.objects.filter(key=request.GET.get('c')).first().value+"图")
filename = datetime.now().strftime("%Y%m%d%H%M%S") + ".png"
plt.savefig(os.path.dirname(__file__) + '\\static\\img\\' + filename, bbox_inches='tight')
return HttpResponse(filename)原文:https://www.cnblogs.com/shy-/p/10751808.html