Table of Contents
Overview : gcs log flush sync wait event
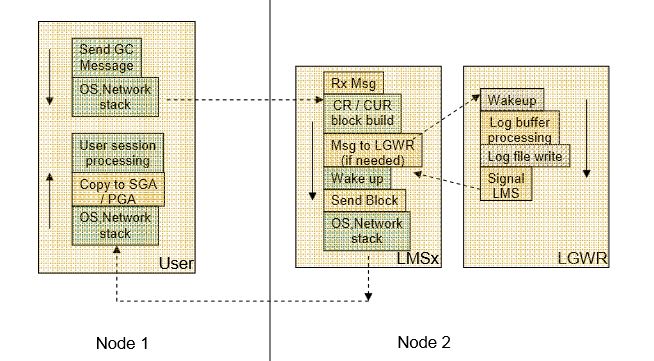
- Before sending a reconstructed CR block or CUR block, LMS will verify that corresponding redo vectors are flushed to disk.
- LMS will flush request a log flush when there are uncomitted transactions within the required block -> Increasing commit frequence will increase this wait event too
- Use lfsdiag.sql script to understand the wait time suffered by LGWR process
- If the redo vector are not flushed, LMS on node2 need to wait for ‘gcs log flush sync’ event after requesting LGWR for a log flush, analogous to ‘log file sync’ event.
- in a healthy database 90 % of GCS Log flush Sync should be 2ms ore less
- Always check related instances for LOG FILE SYNC event as this event also reduces the Redo I/O bandwith
- If gcs log flush sync wait event is significant then you need to understand your LGWR performance ( you may use lfsdiag,sql script )
Monitor gv$session wait events for LGWR, LMS processes
SQL> select w.inst_id, w.sid,w.program, w.event , w.STATE , w.SECONDS_IN_WAIT SEC_in_WAIT , w.P1TEXT || ‘: ‘  || w.P1 || ‘ - ‘    || w.P2TEXT  || ‘: ‘  || w.P2 || ‘ - ‘
      || w.P3TEXT || ‘: ‘  || w.P3 as P1_P2_P3 from gv$session w where
        program like ‘%LGWR%‘ or program like ‘%LMS%‘ or  program like ‘%JDBC%‘ order by program;

INST_ID        SID PROGRAM                          EVENT                         STATE             SEC_IN_WAIT P1_P2_P3
------- ---------- -------------------------------- ---------------------------- ------------------ ----------- ---------------------------------------------
      2         18 oracle@grac42.example.com (LGWR) log file parallel write      WAITED SHORT TIME  0 files: 1 - blocks: 1 - requests: 1
      2         13 oracle@grac42.example.com (LMS0) gcs log flush sync           WAITING            0 waittime: 30 - poll: 0 - event: 138
Gcs Log Flush Sync Wait histogramms
Script:  @event_histogram_from_awr.sql

Acceptable gcs log flush sync histogramm (90 % of wait requests returns in less that 2 ms )
BEGIN_INTERVAL_TIME            Inst    SNAP_ID EVENT_NAME        WAIT_TIME_MILLI WAIT_COUNT
------------------------------ ---- ---------- ----------------  --------------- ----------
28-NOV-13 04.24.27.507 PM         1       876 gcs log flush sync              1      58940
                                  1       876 gcs log flush sync              2      51775
                                  1       876 gcs log flush sync              4       1433
                                  1       876 gcs log flush sync              8        605
                                  1       876 gcs log flush sync             16        271
                                  1       876 gcs log flush sync             32        181
                                  1       876 gcs log flush sync             64        133
                                  1       876 gcs log flush sync            128         78
                                  1       876 gcs log flush sync            256         7
                                  1       876 gcs log flush sync            512         1

Gcs log flush sync wait histogramm with high wait times
28-NOV-13 04.25.58.021 PM         1       877 gcs log flush sync               1        304
                                  1       877 gcs log flush sync               2        662
                                  1       877 gcs log flush sync               4      11816
                                  1       877 gcs log flush sync               8      46981
                                  1       877 gcs log flush sync              16      68740
                                  1       877 gcs log flush sync              32        202
                                  1       877 gcs log flush sync              64        141
                                  1       877 gcs log flush sync             128         83
                                  1       877 gcs log flush sync             256          8
                                  1       877 gcs log flush sync             512          1
References
1、event_histogram_from_awr.sql
set linesize 180
set pagesize 200
col BEGIN_INTERVAL_TIME format A30
col instance_number format 99 head Inst
break on  BEGIN_INTERVAL_TIME
/*
define event_name="gcs log flush sync"
define event_name="log file sync"
*/
select snaps.begin_interval_time, snaps.instance_number,snaps.snap_id,hist.event_name , hist.wait_time_milli, hist.wait_count
  from dba_hist_event_histogram hist, dba_hist_snapshot snaps
 where snaps.snap_id = hist.snap_id and snaps.instance_number = hist.instance_number and
   snaps.begin_interval_time > sysdate - 1/12   -- sysdate - 1/12 -> display AWR reports from the last 2 hours
   AND hist.event_name = lower (‘&&event_name‘)
 order by  snaps.snap_id , snaps.instance_number, wait_time_milli;