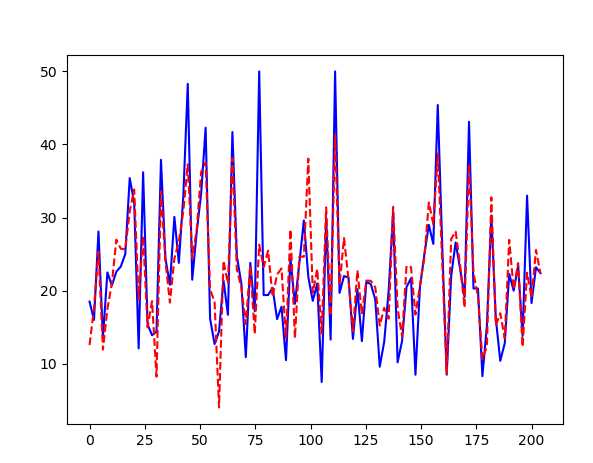
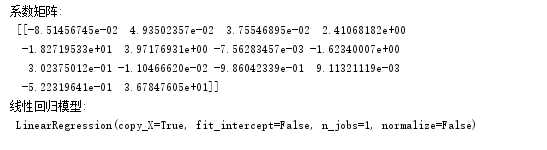
import numpy as np
import sklearn.datasets             #加载原数据
from sklearn.model_selection import train_test_split #分割数据
from matplotlib import pyplot as plt
from sklearn.linear_model import LinearRegression

#创建数据
def createdata():
    boston = sklearn.datasets.load_boston()
    databoston = boston.data
    m,n = np.shape(databoston)
    one_mat = np.ones((m,1))
    databoston = np.column_stack((databoston,one_mat))
    lableboston = boston.target
    x_train,x_test,y_train,y_test= train_test_split(databoston,lableboston,test_size=0.2)       #分割数据测试数据为30%
    x_train = np.mat(x_train)
    y_train = np.mat(y_train).reshape(-1,1)
    x_test = np.mat(x_test)
    y_test = np.mat(y_test).reshape(-1,1)
    # print(x_train[1,:],len(x_train))
    # print(y_train[1],len(y_train))
    return x_train,x_test,y_train,y_test
x_train, x_test, y_train, y_test = createdata()
model = LinearRegression(copy_X=True, fit_intercept=False, n_jobs=1, normalize=False)
model.fit(x_train,y_train)
print(‘系数矩阵:\n‘,model.coef_)
print(‘线性回归模型:\n‘,model)
# 使用模型预测
predicted = model.predict(x_test)
axix_x1 = np.linspace(0,2*len(y_test),len(y_test))
plt.plot(axix_x1, y_test,‘b-‘)
plt.plot(axix_x1, predicted,‘r--‘)
# 显示图形
plt.show()
sklearn库 线性回归库 LinearRegression
原文:https://www.cnblogs.com/cxhzy/p/10764490.html