import numpy as np
import matplotlib.pyplot as plt

from sklearn import mixture
from sklearn.metrics import adjusted_rand_score
from sklearn.datasets.samples_generator import make_blobs

def create_data(centers,num=100,std=0.7):
    X, labels_true = make_blobs(n_samples=num, centers=centers, cluster_std=std)
    return  X,labels_true

#混合高斯聚类GMM模型
def test_GMM(*data):
    X,labels_true=data
    clst=mixture.GaussianMixture()
    clst.fit(X)
    predicted_labels=clst.predict(X)
    print("ARI:%s"% adjusted_rand_score(labels_true,predicted_labels))

# 用于产生聚类的中心点
centers=[[1,1],[2,2],[1,2],[10,20]]
# 产生用于聚类的数据集
X,labels_true=create_data(centers,1000,0.5)
#  调用 test_GMM 函数
test_GMM(X,labels_true)

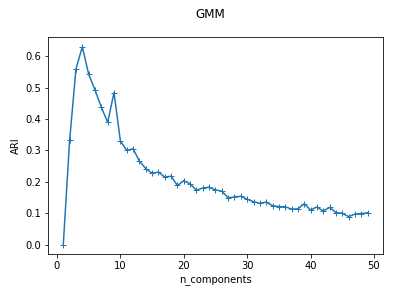
def test_GMM_n_components(*data):
    ‘‘‘
    测试 GMM 的聚类结果随 n_components 参数的影响
    ‘‘‘
    X,labels_true=data
    nums=range(1,50)
    ARIs=[]
    for num in nums:
        clst=mixture.GaussianMixture(n_components=num)
        clst.fit(X)
        predicted_labels=clst.predict(X)
        ARIs.append(adjusted_rand_score(labels_true,predicted_labels))
    ## 绘图
    fig=plt.figure()
    ax=fig.add_subplot(1,1,1)
    ax.plot(nums,ARIs,marker="+")
    ax.set_xlabel("n_components")
    ax.set_ylabel("ARI")
    fig.suptitle("GMM")
    plt.show()

#  调用 test_GMM_n_components 函数
test_GMM_n_components(X,labels_true)
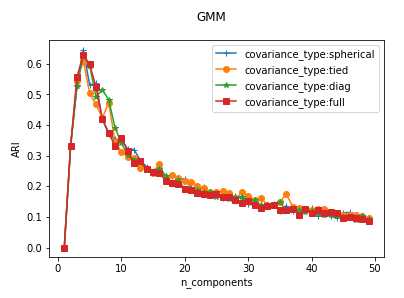
def test_GMM_cov_type(*data):
    ‘‘‘
    测试 GMM 的聚类结果随协方差类型的影响
    ‘‘‘
    X,labels_true=data
    nums=range(1,50)

    cov_types=[‘spherical‘,‘tied‘,‘diag‘,‘full‘]
    markers="+o*s"
    fig=plt.figure()
    ax=fig.add_subplot(1,1,1)

    for i ,cov_type in enumerate(cov_types):
        ARIs=[]
        for num in nums:
            clst=mixture.GaussianMixture(n_components=num,covariance_type=cov_type)
            clst.fit(X)
            predicted_labels=clst.predict(X)
            ARIs.append(adjusted_rand_score(labels_true,predicted_labels))
        ax.plot(nums,ARIs,marker=markers[i],label="covariance_type:%s"%cov_type)

    ax.set_xlabel("n_components")
    ax.legend(loc="best")
    ax.set_ylabel("ARI")
    fig.suptitle("GMM")
    plt.show()

#  调用 test_GMM_cov_type 函数
test_GMM_cov_type(X,labels_true)
原文:https://www.cnblogs.com/tszr/p/10799048.html