Since JMeter 3.0, last version being 3.3, JMeter provides Out Of The Box a dynamic Web report with tons of information.
You can read an up to date blog (15th january 2019) described here.
We highly advise you to use it instead of what is described below which is no more necessary.
Report contains more sexy graphs, tables (Errors synthesis, Top 5 errors by sampler, APDEX…) that will help you analyze your load test more easily and open it in a Browser.
Creating it is just a matter of adding 2 more command-line options in NON GUI load test.
We are the proud implementers and contributors of this web-report that was partly sponsored by Decathlon (a great French and worldwide sports company).
You are using Apache JMeter for your Load Tests.
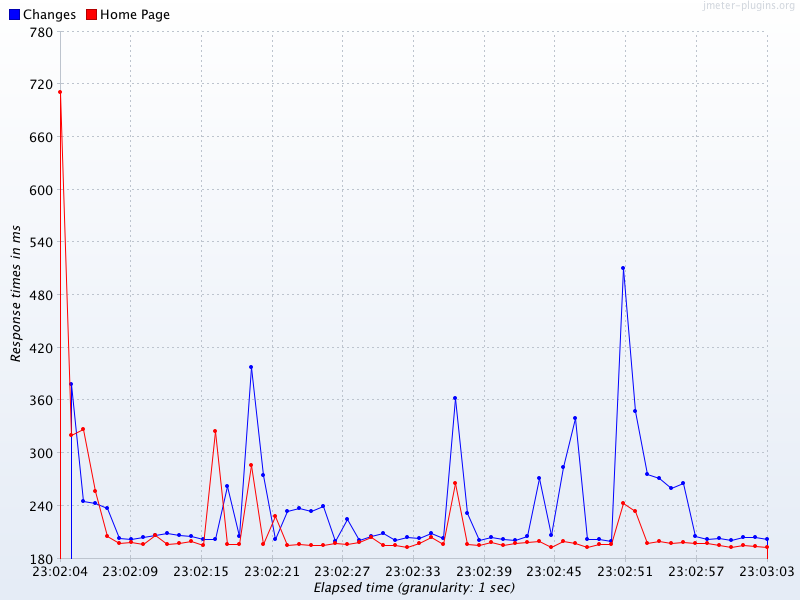
Once test has ended, you would like your favorite tool to automatically generate for you nice and meaningful graphs so that you can faster analyze your test results and include them in your report.
Apache JMeter is great in many ways but its core lacks this built-in feature, but it’s plugin Architecture will let us add it easily.
Hopefully a great must have Open Source and free third-party library called JMeter-Plugins comes to the rescue.
Before version 1.1.3 of JMeter-Plugins, you could use JMeterPluginsCMD Command Line Tool to generate your graphs in a shell, but this was not optimal.
As users of both Apache JMeter and JMeter-Plugins, we decided to contribute this new feature to JMeter-Plugins.
Our philosophy is :
Philippe Mouawad works as an Architect and technical expert for Ubik-Ingenierie where he leads among other things the development of UbikLoadPack a set of Commercial Plugins for Apache JMeter allowing to load test different protocols like HLS, GWT, Flex.
Philippe is a committer on the Apache JMeter project and member of the PMC since October 2011.
Finally he is a co-author of a french book on JMeter called Maîriser JMeter: Du test de charge à Devops.
To automatically generate your reports just add a new Listener called “jp@gc Graphs Generator“.
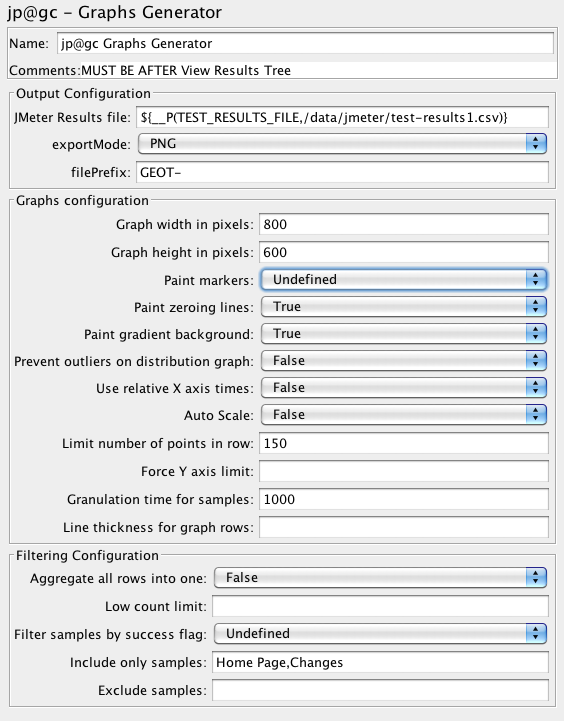
You can define the following properties:
| Property | Description/Possible Values |
| Graph width in pixels | for PNG only – width of the image, default is 800 |
| Graph height in pixels | for PNG only – height of the image, default is 600 |
| granulation time for samples | granulation time for samples |
| relative-times <true/false> | use relative X axis times, no will set absolute times |
| Aggregate all Rows into one | True/False |
| Paint gradient background | True/False |
| Paint markers | paint markers |
| Paint zeroing lines | paint zeroing lines |
| paint-markers <yes/no> | paint markers on data points (since 1.1.3) |
| prevent-outliers <yes/no> | prevent outliers on distribution graph |
| Limit number of points in row | limit number of points in row |
| Force Y axis limit | Force input value as Y axis limit |
| Low count limit | hide points with sample count below input limit |
| success-filter <true/false/Undefined> | filter samples by success flag (since 0.5.6), possible values are:
|
| Include only samples | Comma-separated list of samples to be graphed |
| Exclude samples | Exclude from report samples with specified labels, comma-separated |
| Auto-Scale | enable/disable auto-scale multipliers for perfmon/composite graph |
| line thickness for graph rows | line thickness for graph rows |
Edit <jmeter home>/bin/user.properties and ensure you set these properties:
jmeter.save.saveservice.output_format=csv

jmeter.save.saveservice.data_type=false

jmeter.save.saveservice.label=true

jmeter.save.saveservice.response_code=true

jmeter.save.saveservice.response_data.on_error=false

jmeter.save.saveservice.response_message=false

jmeter.save.saveservice.assertion_results_failure_message=false

jmeter.save.saveservice.successful=true

jmeter.save.saveservice.thread_name=true

jmeter.save.saveservice.time=true

jmeter.save.saveservice.subresults=false

jmeter.save.saveservice.assertions=true

jmeter.save.saveservice.latency=true

jmeter.save.saveservice.bytes=true

jmeter.save.saveservice.hostname=true


# This will enable correct graphs display

# which deal with threads after reloading the results file.

jmeter.save.saveservice.thread_counts=true


jmeter.save.saveservice.sample_count=true

jmeter.save.saveservice.timestamp_format=HH:mm:ss

jmeter.save.saveservice.default_delimiter=;

jmeter.save.saveservice.print_field_names=true

# This is needed to ensure all results are

# available when Listener runs

jmeter.save.saveservice.autoflush=true
If using distributed testing, ensure you add to your Thread Group names:
${__machineName()}_My Threadgroup name
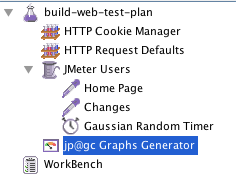
We will use a test plan you can easily create with Templates…> Building a Web Test Plan
We just added an Http Cookie Manager and removed Graph Results listener.
We end up with this, the only listener is the new jp@gc Graphs Generator
Now run this plan in NON-GUI mode as per JMeter Best-Practices using following command-line:
./jmeter -t GraphsReportListener-GenerationAtEndOfTestNonGUI.jmx -n

  -l /data/jmeter/test-results.csv

 -JTEST_RESULTS_FILE=/data/jmeter/test-results.csv
Notice the following:

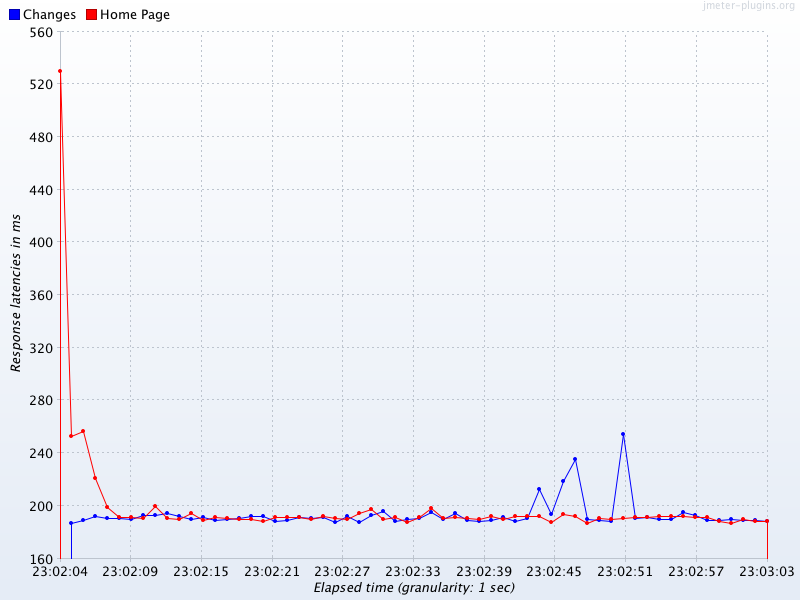
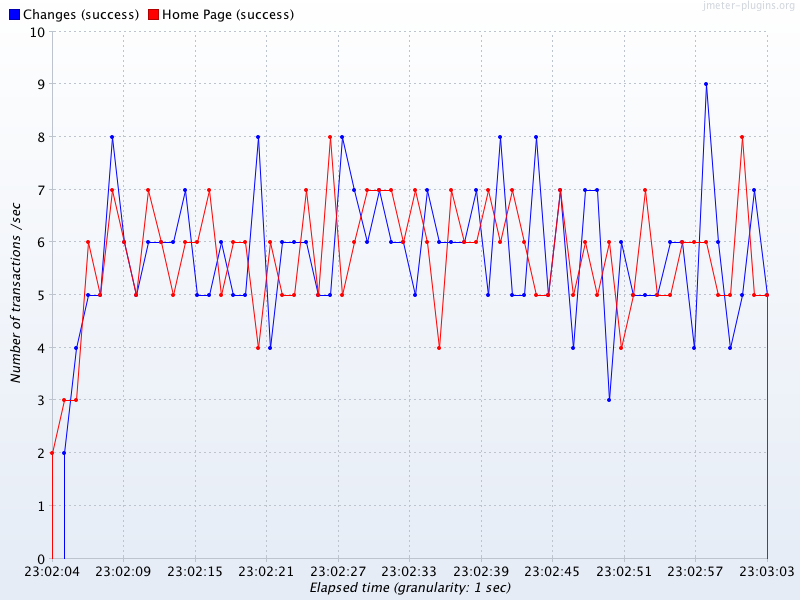
In this configuration, notice we have decided to only include 2 samples:
In a real worl scenario, you would use Transaction Controller for meaningful transaction names and only include those in your report.
At end of test JMeter automatically generated in <jmeter home>/bin folder the following files:
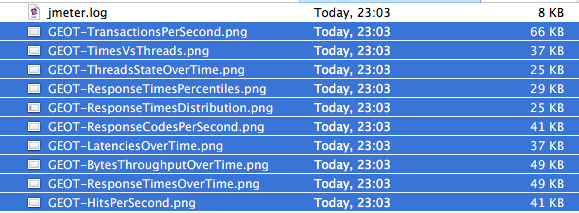
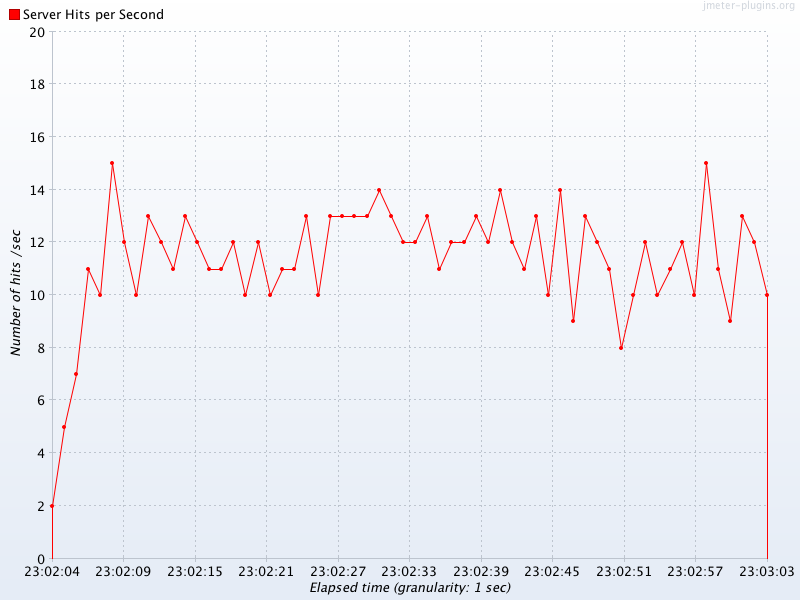
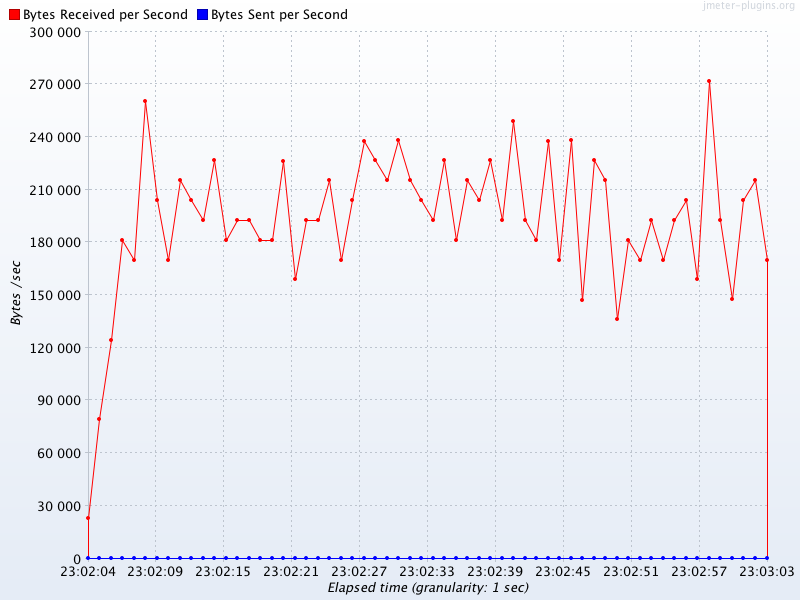
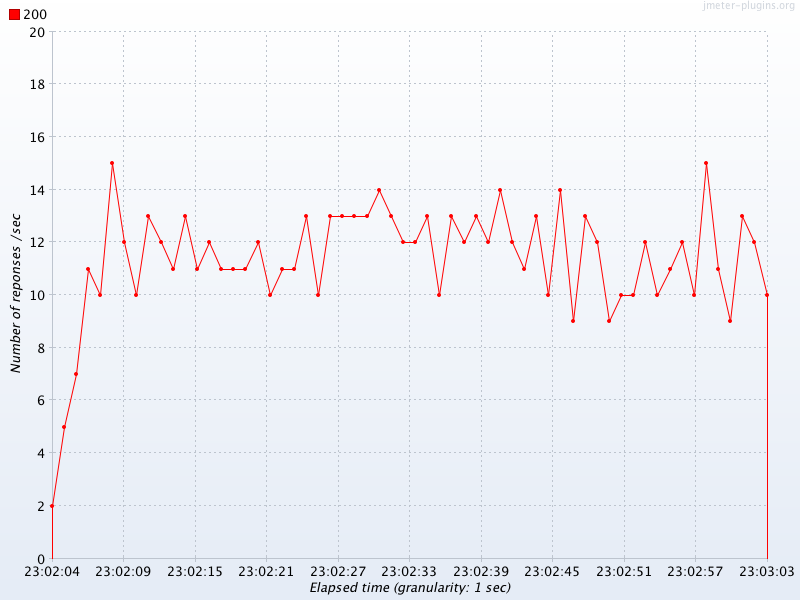
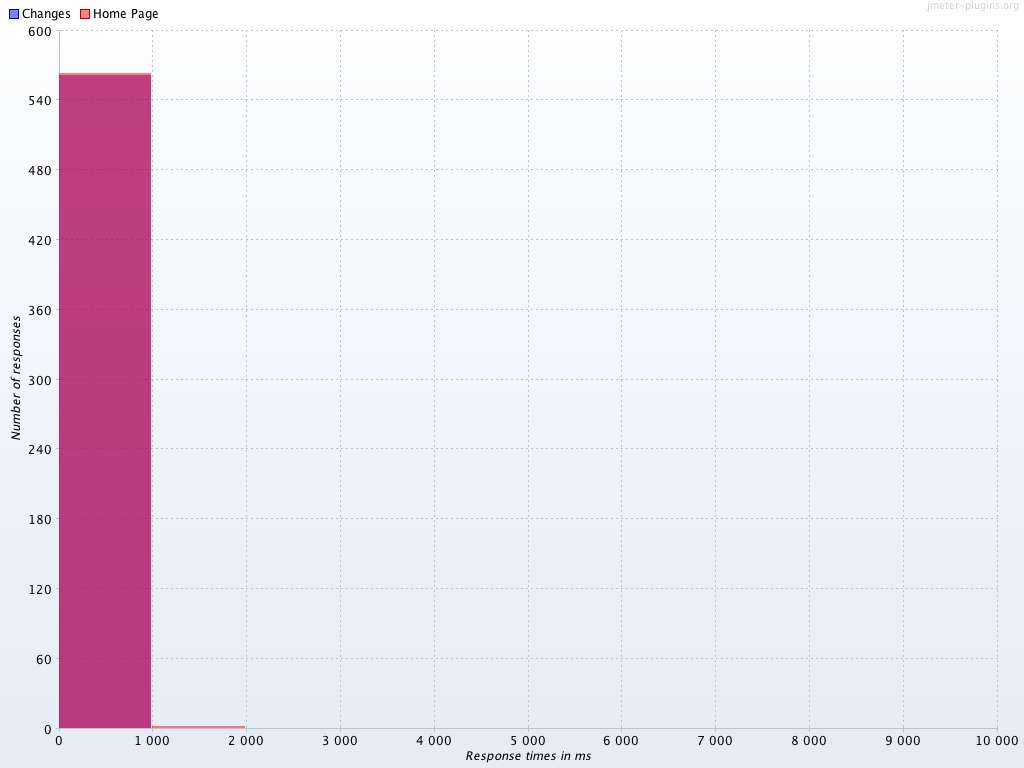
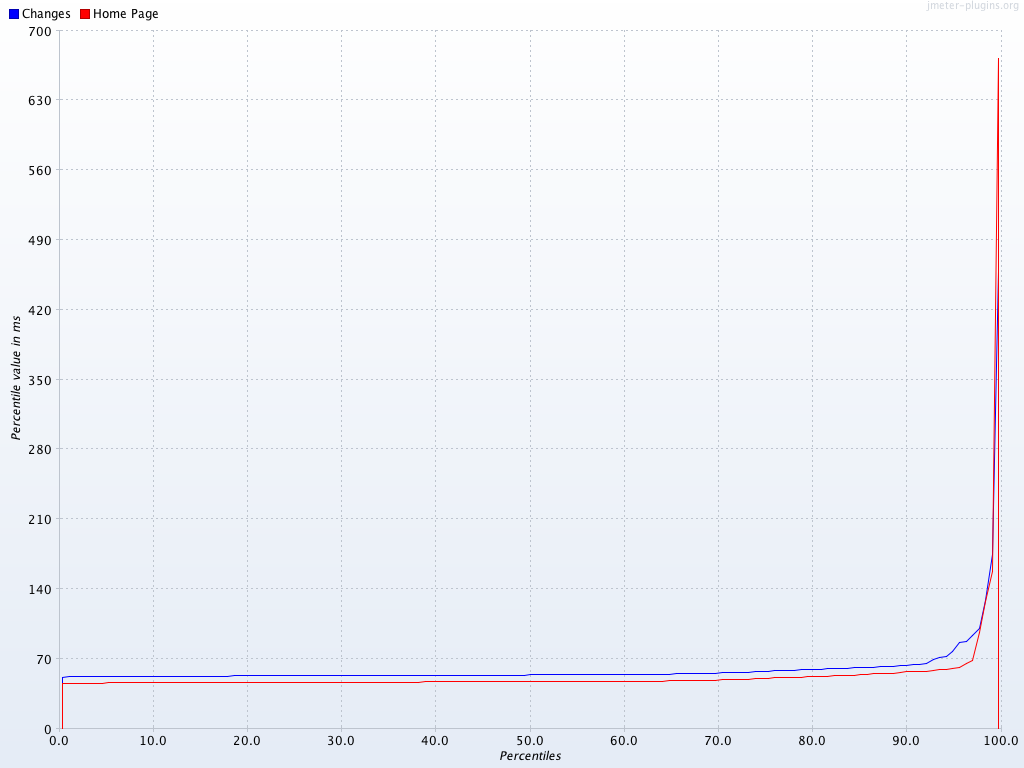
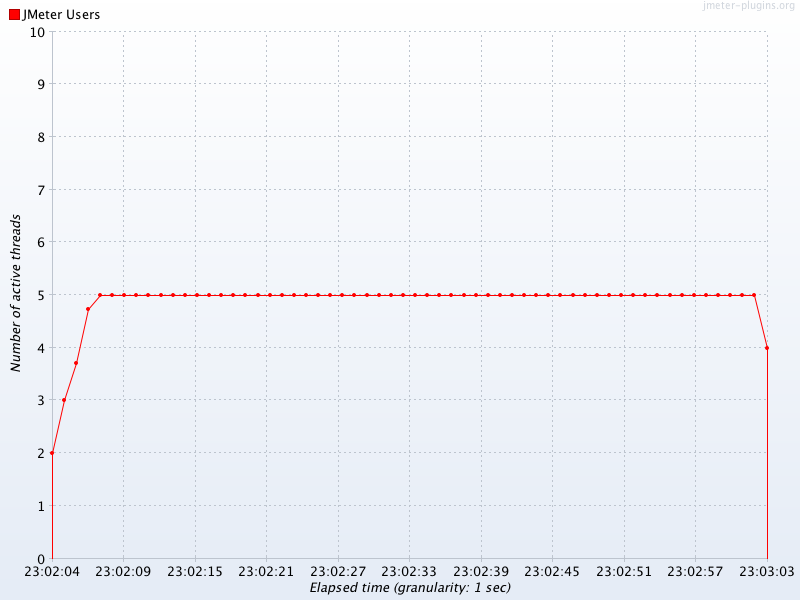
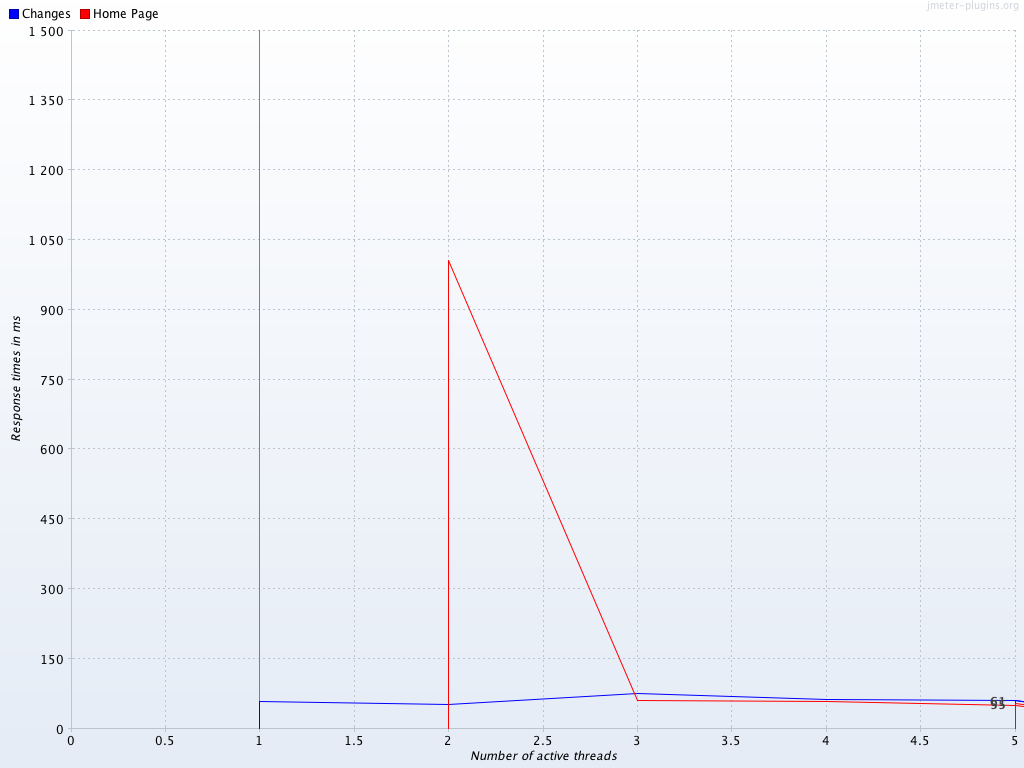
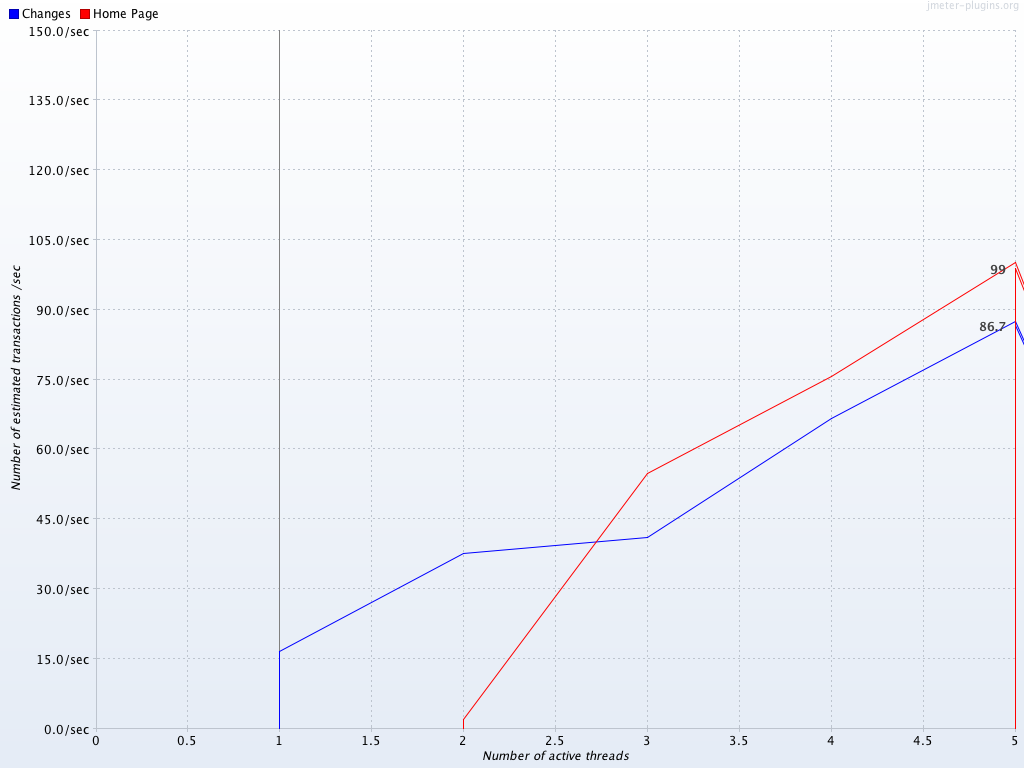
Graphs Generator Listener can also generate CSV files besides PNG files.
Graph Generator Listener can even generate graphs for existing results, to do so, create a fake plan like the following:
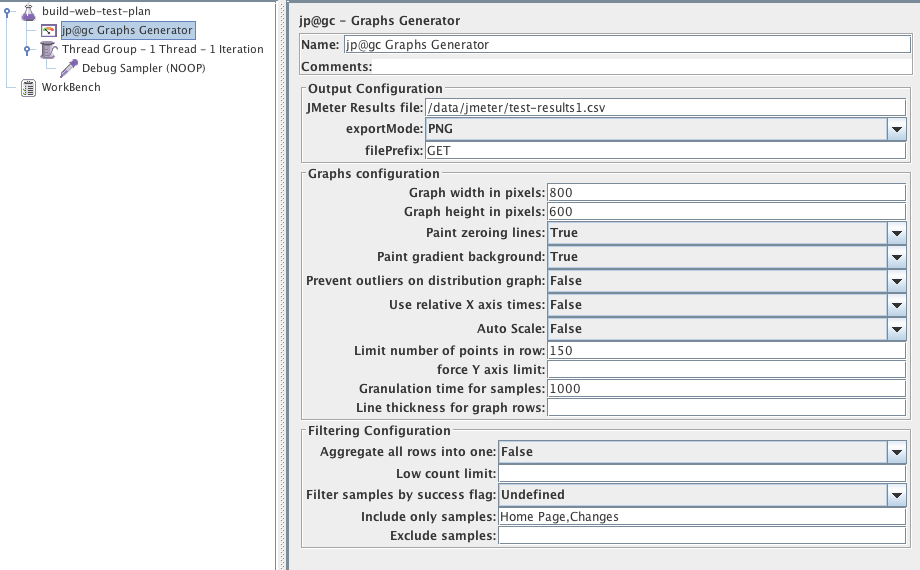
Run it in GUI or NON-GUI mode, the graphs will be generated.
Ensure you use the same properties configuration you used during the test that generated the results you are graphing.
With this new Graphs Generator Listener , you can now easily:
Philippe Mouawad is a developer, committer and member of the JMeter Project Management Committee at Apache.
He is also the co-author of the book Master JMeter : from load testing to DevOps
Automatically generating nice graphs at end of your Load Test with Apache JMeter and JMeter-Plugins
原文:https://www.cnblogs.com/a00ium/p/10853949.html