git clone https://github.com/ultralytics/yolov3.gitconda create -n yolov3 python=3.7pip install -r requirements.txt环境要求:
其中只需要注意pytorch的安装:
到https://pytorch.org/中根据操作系统,python版本,cuda版本等选择命令即可。
关于深度学习环境搭建请参看:https://www.cnblogs.com/pprp/p/9463974.html
anaconda常用用法:https://www.cnblogs.com/pprp/p/9463124.html
在Windows下使用:wget https://github.com/pprp/DL/blob/master/LabelIMG.zipCtrl + u 加载目录中的所有图像,鼠标点击Open dir同功能
Ctrl + r 更改默认注释目标目录(xml文件保存的地址)
Ctrl + s 保存
Ctrl + d 复制当前标签和矩形框
space 将当前图像标记为已验证
w 创建一个矩形框
d 下一张图片
a 上一张图片
del 删除选定的矩形框
Ctrl++ 放大
Ctrl-- 缩小
↑→↓← 键盘箭头移动选定的矩形框-data
- VOCdevkit2007
- VOC2007
- Annotations (标签XML文件,用对应的图片处理工具人工生成的)
- ImageSets (生成的方法是用sh或者MATLAB语言生成)
- Main
- test.txt
- train.txt
- trainval.txt
- val.txt
- JPEGImages(原始文件)
- labels (xml文件对应的txt文件)通过以上软件主要构造好JPEGImages和Annotations文件夹中内容,Main文件夹中的txt文件可以通过python脚本生成:
import os
import random

trainval_percent = 0.8
train_percent = 0.8
xmlfilepath = 'Annotations'
txtsavepath = 'ImageSets\Main'
total_xml = os.listdir(xmlfilepath)

num=len(total_xml)
list=range(num)
tv=int(num*trainval_percent)
tr=int(tv*train_percent)
trainval= random.sample(list,tv)
train=random.sample(trainval,tr)

ftrainval = open('ImageSets/Main/trainval.txt', 'w')
ftest = open('ImageSets/Main/test.txt', 'w')
ftrain = open('ImageSets/Main/train.txt', 'w')
fval = open('ImageSets/Main/val.txt', 'w')

for i  in list:
    name=total_xml[i][:-4]+'\n'
    if i in trainval:
        ftrainval.write(name)
        if i in train:
            ftrain.write(name)
        else:
            fval.write(name)
    else:
        ftest.write(name)

ftrainval.close()
ftrain.close()
fval.close()
ftest.close()
生成labels文件,voc_label.py文件具体内容如下:
# -*- coding: utf-8 -*-
"""
Created on Tue Oct  2 11:42:13 2018
将本文件放到VOC2007目录下,然后就可以直接运行
需要修改的地方:
1. sets中替换为自己的数据集
2. classes中替换为自己的类别
3. 将本文件放到VOC2007目录下
4. 直接开始运行
"""

import xml.etree.ElementTree as ET
import pickle
import os
from os import listdir, getcwd
from os.path import join
sets=[('2007', 'train'), ('2007', 'val'), ('2007', 'test')]  #替换为自己的数据集
classes = ["head", "eye", "nose"]     #修改为自己的类别
#classes = ["eye", "nose"]

def convert(size, box):
    dw = 1./(size[0])
    dh = 1./(size[1])
    x = (box[0] + box[1])/2.0 - 1
    y = (box[2] + box[3])/2.0 - 1
    w = box[1] - box[0]
    h = box[3] - box[2]
    x = x*dw
    w = w*dw
    y = y*dh
    h = h*dh
    return (x,y,w,h)
def convert_annotation(year, image_id):
    in_file = open('VOC%s/Annotations/%s.xml'%(year, image_id))  #将数据集放于当前目录下
    out_file = open('VOC%s/labels/%s.txt'%(year, image_id), 'w')
    tree=ET.parse(in_file)
    root = tree.getroot()
    size = root.find('size')
    w = int(size.find('width').text)
    h = int(size.find('height').text)
    for obj in root.iter('object'):
        difficult = obj.find('difficult').text
        cls = obj.find('name').text
        if cls not in classes or int(difficult)==1:
            continue
        cls_id = classes.index(cls)
        xmlbox = obj.find('bndbox')
        b = (float(xmlbox.find('xmin').text), float(xmlbox.find('xmax').text), float(xmlbox.find('ymin').text), float(xmlbox.find('ymax').text))
        bb = convert((w,h), b)
        out_file.write(str(cls_id) + " " + " ".join([str(a) for a in bb]) + '\n')
wd = getcwd()
for year, image_set in sets:
    if not os.path.exists('VOC%s/labels/'%(year)):
        os.makedirs('VOC%s/labels/'%(year))
    image_ids = open('VOC%s/ImageSets/Main/%s.txt'%(year, image_set)).read().strip().split()
    list_file = open('%s_%s.txt'%(year, image_set), 'w')
    for image_id in image_ids:
        list_file.write('VOC%s/JPEGImages/%s.jpg\n'%(year, image_id))
        convert_annotation(year, image_id)
    list_file.close()
#os.system("cat 2007_train.txt 2007_val.txt > train.txt")     #修改为自己的数据集用作训练
到底为止,VOC格式数据集构造完毕,但是还需要继续构造符合darknet格式的数据集。
(运行bash yolov3/data/get_coco_dataset.sh,仿照格式将数据放到其中)
但是这个库还需要其他模型:
其中保存的是你的所有的类别,每行一个类别,如data/coco.names:
head
eye
noseclasses = 3 # 改成你的数据集的类别个数
train = ./data/2007_train.txt # 通过voc_label.py文件生成的txt文件
valid = ./data/2007_test.txt # 通过voc_label.py文件生成的txt文件
names = data/coco.names # 记录类别
backup = backup/ # 记录checkpoint存放位置
eval = coco # 选择map计算方式打开cfg文件夹下的yolov3.cfg文件,大体而言,cfg文件记录的是整个网络的结构,是核心部分,具体内容讲解请见:https://pprp.github.io/2018/09/20/tricks.html
只需要更改每个[yolo]层前边卷积层的filter个数即可:
每一个[region/yolo]层前的最后一个卷积层中的 filters=num(yolo层个数)*(classes+5) ,5的意义是5个坐标,论文中的tx,ty,tw,th,po
举个例子:我有三个类,n = 3, 那么filter = 3 * (3+5) = 21
[convolutional]
size=1
stride=1
pad=1
filters=255 # 改为 21
activation=linear


[yolo]
mask = 6,7,8
anchors = 10,13,  16,30,  33,23,  30,61,  62,45,  59,119,  116,90,  156,198,  373,326
classes=80 # 改为 3
num=9
jitter=.3
ignore_thresh = .7
truth_thresh = 1
random=1预训练模型:
*.weights format: https://pjreddie.com/media/files/yolov3.weights*.pt format: https://drive.google.com/drive/folders/1uxgUBemJVw9wZsdpboYbzUN4bcRhsuAI开始训练:
python train.py --data data/coco.data --cfg cfg/yolov3.cfg如果日志正常输出那证明可以运行了
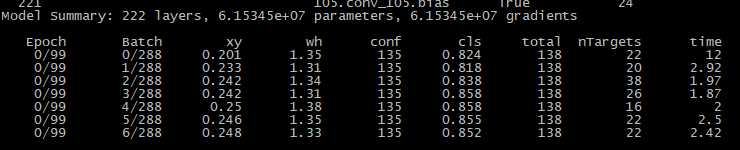
如果中断了,可以恢复训练
python train.py --data data/coco.data --cfg cfg/yolov3.cfg --resume将待测试图片放到data/samples中,然后运行
python detect.py --weights weights/best.ptpython test.py --weights weights/latest.pt如果使用cocoAPI使用以下命令:
git clone https://github.com/cocodataset/cocoapi && cd cocoapi/PythonAPI && make && cd ../.. && cp -r cocoapi/PythonAPI/pycocotools yolov3
cd yolov3

python3 test.py --save-json --img-size 416
Namespace(batch_size=32, cfg='cfg/yolov3-spp.cfg', conf_thres=0.001, data_cfg='data/coco.data', img_size=416, iou_thres=0.5, nms_thres=0.5, save_json=True, weights='weights/yolov3-spp.weights')
Using CUDA device0 _CudaDeviceProperties(name='Tesla V100-SXM2-16GB', total_memory=16130MB)
               Class    Images   Targets         P         R       mAP        F1
Calculating mAP: 100%|█████████████████████████████████████████| 157/157 [05:59<00:00,  1.71s/it]
                 all     5e+03  3.58e+04     0.109     0.773      0.57     0.186
 Average Precision  (AP) @[ IoU=0.50:0.95 | area=   all | maxDets=100 ] = 0.335
 Average Precision  (AP) @[ IoU=0.50      | area=   all | maxDets=100 ] = 0.565
 Average Precision  (AP) @[ IoU=0.75      | area=   all | maxDets=100 ] = 0.349
 Average Precision  (AP) @[ IoU=0.50:0.95 | area= small | maxDets=100 ] = 0.151
 Average Precision  (AP) @[ IoU=0.50:0.95 | area=medium | maxDets=100 ] = 0.360
 Average Precision  (AP) @[ IoU=0.50:0.95 | area= large | maxDets=100 ] = 0.493
 Average Recall     (AR) @[ IoU=0.50:0.95 | area=   all | maxDets=  1 ] = 0.280
 Average Recall     (AR) @[ IoU=0.50:0.95 | area=   all | maxDets= 10 ] = 0.432
 Average Recall     (AR) @[ IoU=0.50:0.95 | area=   all | maxDets=100 ] = 0.458
 Average Recall     (AR) @[ IoU=0.50:0.95 | area= small | maxDets=100 ] = 0.255
 Average Recall     (AR) @[ IoU=0.50:0.95 | area=medium | maxDets=100 ] = 0.494
 Average Recall     (AR) @[ IoU=0.50:0.95 | area= large | maxDets=100 ] = 0.620

python3 test.py --save-json --img-size 608 --batch-size 16
Namespace(batch_size=16, cfg='cfg/yolov3-spp.cfg', conf_thres=0.001, data_cfg='data/coco.data', img_size=608, iou_thres=0.5, nms_thres=0.5, save_json=True, weights='weights/yolov3-spp.weights')
Using CUDA device0 _CudaDeviceProperties(name='Tesla V100-SXM2-16GB', total_memory=16130MB)
               Class    Images   Targets         P         R       mAP        F1
Computing mAP: 100%|█████████████████████████████████████████| 313/313 [06:11<00:00,  1.01it/s]
                 all     5e+03  3.58e+04      0.12      0.81     0.611     0.203
 Average Precision  (AP) @[ IoU=0.50:0.95 | area=   all | maxDets=100 ] = 0.366
 Average Precision  (AP) @[ IoU=0.50      | area=   all | maxDets=100 ] = 0.607
 Average Precision  (AP) @[ IoU=0.75      | area=   all | maxDets=100 ] = 0.386
 Average Precision  (AP) @[ IoU=0.50:0.95 | area= small | maxDets=100 ] = 0.207
 Average Precision  (AP) @[ IoU=0.50:0.95 | area=medium | maxDets=100 ] = 0.391
 Average Precision  (AP) @[ IoU=0.50:0.95 | area= large | maxDets=100 ] = 0.485
 Average Recall     (AR) @[ IoU=0.50:0.95 | area=   all | maxDets=  1 ] = 0.296
 Average Recall     (AR) @[ IoU=0.50:0.95 | area=   all | maxDets= 10 ] = 0.464
 Average Recall     (AR) @[ IoU=0.50:0.95 | area=   all | maxDets=100 ] = 0.494
 Average Recall     (AR) @[ IoU=0.50:0.95 | area= small | maxDets=100 ] = 0.331
 Average Recall     (AR) @[ IoU=0.50:0.95 | area=medium | maxDets=100 ] = 0.517
Average Recall (AR) @[ IoU=0.50:0.95 | area= large | maxDets=100 ] = 0.618可以使用python -c from utils import utils;utils.plot_results()
创建drawLog.py
def plot_results():
    # Plot YOLO training results file 'results.txt'
    import glob
    import numpy as np
    import matplotlib.pyplot as plt
    #import os; os.system('rm -rf results.txt && wget https://storage.googleapis.com/ultralytics/results_v1_0.txt')

    plt.figure(figsize=(16, 8))
    s = ['X', 'Y', 'Width', 'Height', 'Objectness', 'Classification', 'Total Loss', 'Precision', 'Recall', 'mAP']
    files = sorted(glob.glob('results.txt'))
    for f in files:
        results = np.loadtxt(f, usecols=[2, 3, 4, 5, 6, 7, 8, 17, 18, 16]).T  # column 16 is mAP
        n = results.shape[1]
        for i in range(10):
            plt.subplot(2, 5, i + 1)
            plt.plot(range(1, n), results[i, 1:], marker='.', label=f)
            plt.title(s[i])
            if i == 0:
                plt.legend()
    plt.savefig('./plot.png')
if __name__ == "__main__":
    plot_results()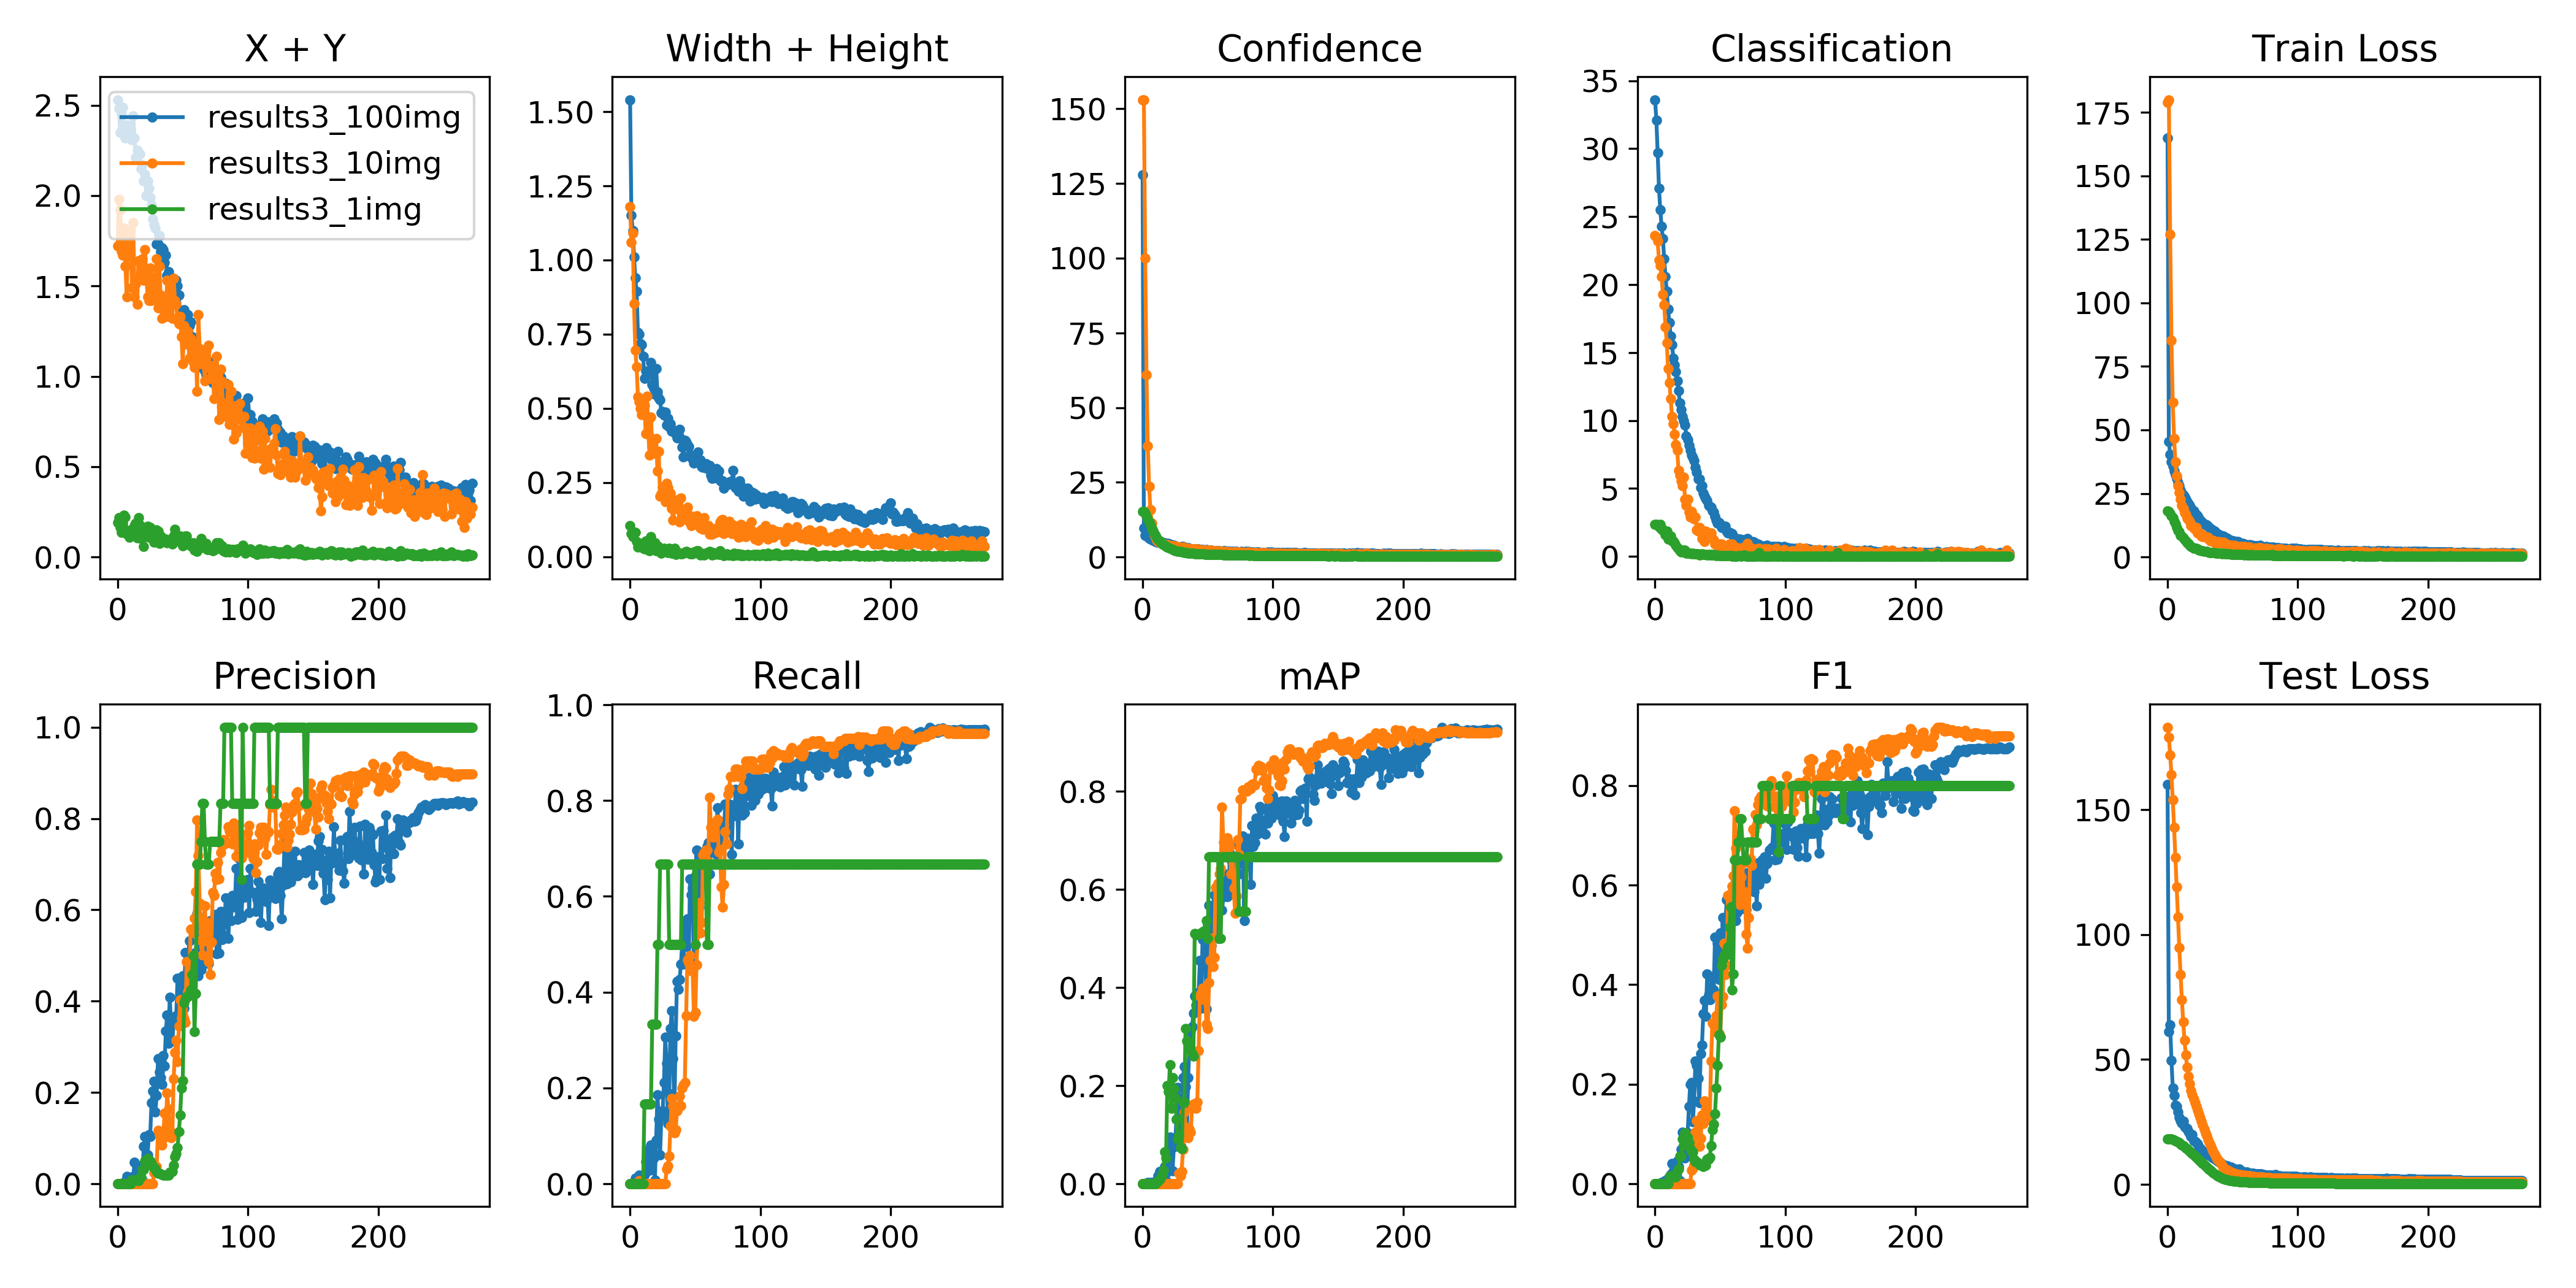
详细cfg文件讲解:https://pprp.github.io/2018/09/20/tricks.html
参考资料以及网络更改经验:https://pprp.github.io/2018/06/20/yolo.html
原文:https://www.cnblogs.com/pprp/p/10863496.html