vi /etc/systemd/system/bind_exporter.service
内容如下,注意此处的用户和组使用与named程序相同的用户和组“named”。--web.listen-address为对外暴露的metric地址和端口,Prometheus从此处抓取bind_exporter的metrics;--bind.stats-url为本地bind服务绑定的地址和IP
[Unit]
Description=bind_exporter
Documentation=https://github.com/digitalocean/bind_exporter
Wants=network-online.target
After=network-online.target

[Service]
Type=simple
User=named
Group=named
ExecReload=/bin/kill -HUP $MAINPID
ExecStart=/opt/bind_exporter/bind_exporter   --bind.pid-file=/var/run/named/named.pid   --bind.timeout=20s   --web.listen-address=0.0.0.0:9119   --web.telemetry-path=/metrics   --bind.stats-url=http://localhost:53/ \
  --bind.stats-groups=server,view,tasks

SyslogIdentifier=bind_exporter
Restart=always

[Install]
WantedBy=multi-user.target
systemctl daemon-reload
systemctl restart bind_exporter.service
statistics-channels {
  inet 127.0.0.1 port 53 allow { 127.0.0.1; };
};
重新启动named
service named restart
  - job_name: dns-master
    static_configs:
      - targets: [‘10.85.6.66:9119‘]
        labels:
          alias: dns-master
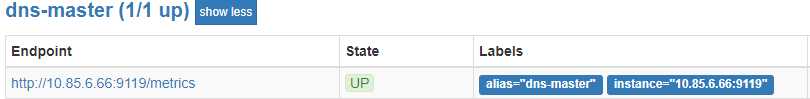
在Prometheus的targets中可以看到新加的内容
可以通过“curl http://10.85.6.66:9119/metrics”来获取bind_exporter支持的metrics以及方法,最常用的方法为“bind_up”,用于查看一个bind服务是否启动,值1表示启动成功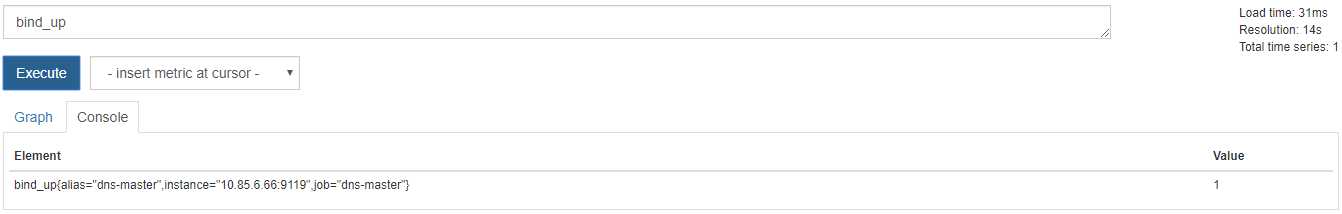
参考:
https://grafana.com/dashboards/1666
https://computingforgeeks.com/how-to-monitor-bind-dns-server-with-prometheus-and-grafana/
原文:https://www.cnblogs.com/charlieroro/p/11013428.html