
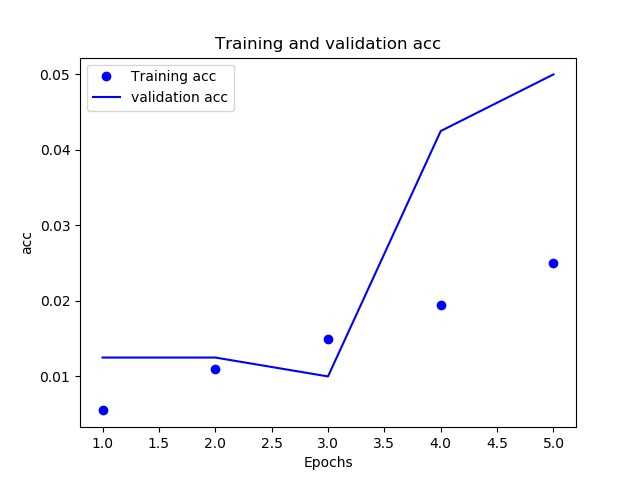
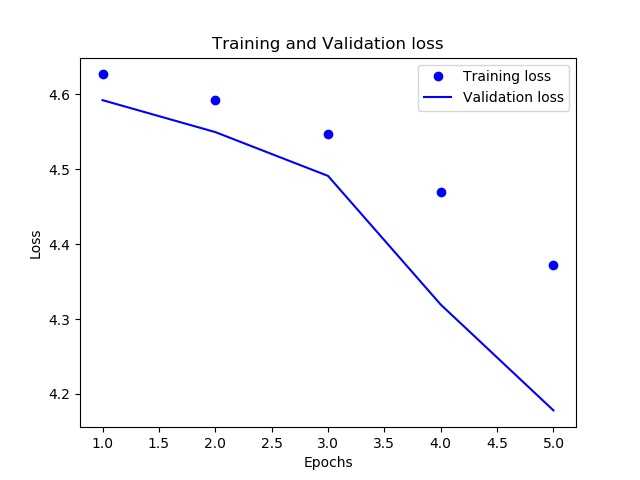
 1 """ python绘制神经网络训练精度与损失 """
 2
 3 # 导入相应包
 4 from matplotlib import pyplot as plt
 5
 6 # 构造绘图函数
 7 def drow(history):
 8     epochs = range(1, len(history[‘loss‘]) + 1)
 9     plt.plot(epochs, history[‘loss‘], ‘bo‘, label=‘Training loss‘)
10     plt.plot(epochs, history[‘val_loss‘], ‘b‘, label=‘Validation loss‘)
11     plt.title(‘Training and Validation loss‘)
12     plt.xlabel(‘Epochs‘)
13     plt.ylabel(‘Loss‘)
14     plt.legend()
15
16     plt.imsave(‘E:/acc_and_loss/Training and Validation loss.jpg‘)
17
18     plt.figure()
19     epochs = range(1, len(history[‘acc‘]) + 1)
20     plt.plot(epochs, history[‘acc‘], ‘bo‘, label=‘Training acc‘)
21     plt.plot(epochs, history[‘val_acc‘], ‘b‘, label=‘validation acc‘)
22     plt.title(‘Training and validation acc‘)
23     plt.xlabel(‘Epochs‘)
24     plt.ylabel(‘acc‘)
25     plt.legend()
26
27     plt.imsave(‘E:/acc_and_loss/Training and validation acc.jpg‘)
28
29     plt.show()
绘制图形展示: 2019-08-07 22:47:00
 |
 |
原文:https://www.cnblogs.com/Junlong/p/11318333.html
