首页 > 其他 > 详细

饼状图--只有一个指标

时间:2019-09-02 22:09:22      阅读:100      评论:0      收藏:0      [点我收藏+]

 直接将下面的代码放入 

https://gallery.echartsjs.com/editor.html?c=xBy9Gn_x99  就可以了  进行调试 

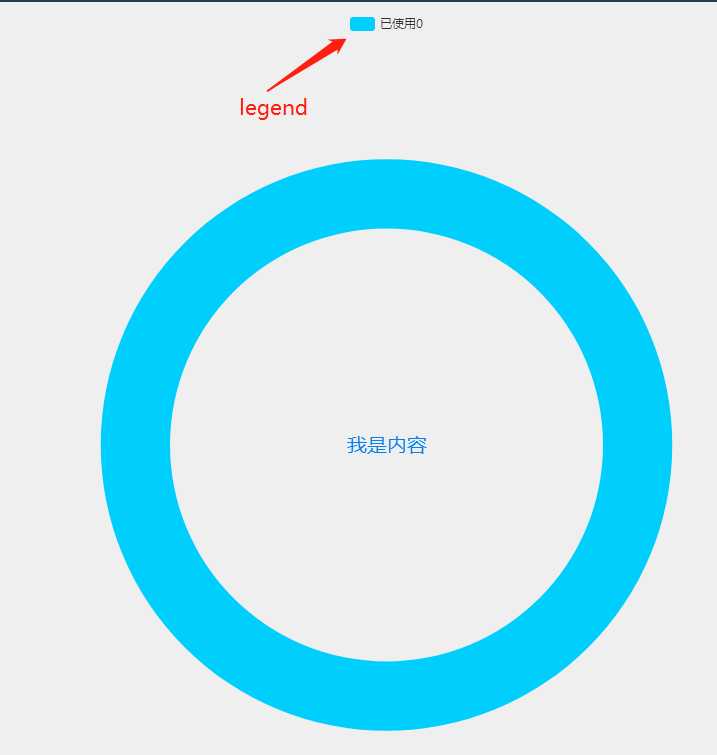
option = {
    
            title: {
              text: ‘我是内容‘,
              x: ‘center‘,
              y: ‘center‘,
              textStyle: {
                fontWeight: ‘normal‘,
                color: ‘#0580f2‘,
                fontSize: ‘20‘
              }
            },
            
            
            //那个指标
            legend: {
              show: true,
              itemGap: 12,
              data: [‘已使用0‘]
            },


            series: [{
              type: ‘pie‘,
              clockWise: true, //饼图的扇区是否是顺时针排布。 
              radius: [‘50%‘, ‘66%‘], //调节宽度的大小
              itemStyle: {
                normal: {
                  label: {
                    show: false
                  },
                  labelLine: {
                    show: false
                  }
                }
              },
              hoverAnimation: false,
              data: [{
                value: 80,
                name: ‘已使用0‘,
                itemStyle: {
                  normal: {
                    color: { // 完成的圆环的颜色
                      colorStops: [{
                        offset: 0,
                        color: ‘#00cefc‘ // 0% 处的颜色
                      }, {
                        offset: 1,
                        color: ‘#00cefc‘ // 100% 处的颜色
                      }]
                    },
                    label: {
                      show: false
                    },
                    labelLine: {
                      show: false
                    }
                  }
                }
              }]
            }]
        };


技术分享图片


饼状图--只有一个指标

原文:https://www.cnblogs.com/IwishIcould/p/11449156.html

(0)
(0)
   
举报
评论 一句话评论(0
关于我们 - 联系我们 - 留言反馈 - 联系我们:wmxa8@hotmail.com
© 2014 bubuko.com 版权所有
打开技术之扣,分享程序人生!