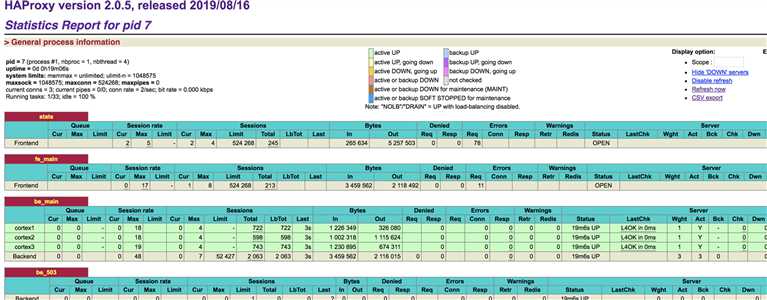
cortex 支持多实例运行,可以灵活实际大规模的部署,以下demo,运行了三个cortex 实例,没有配置副本数(主要是ha )
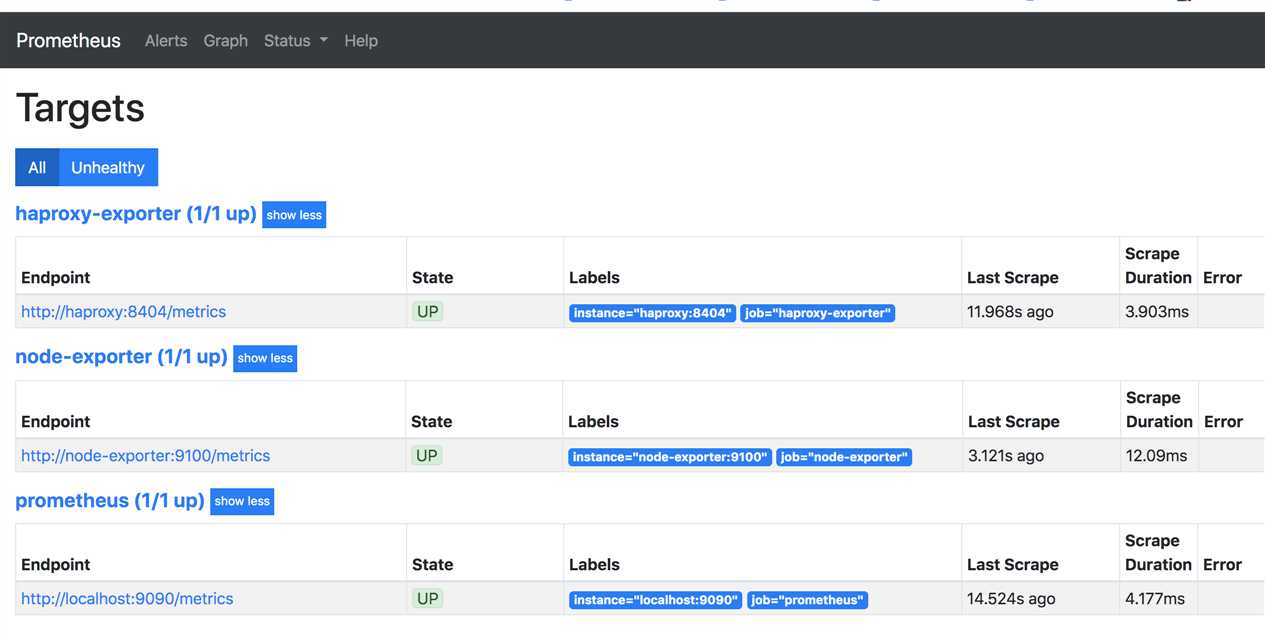
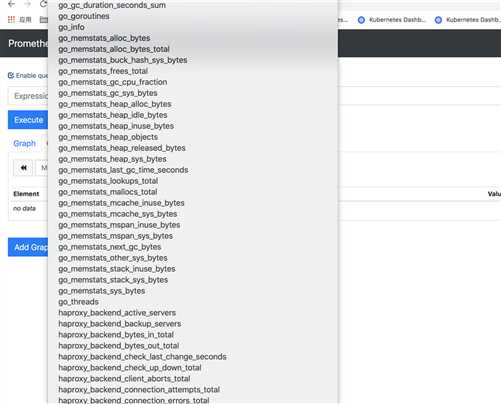
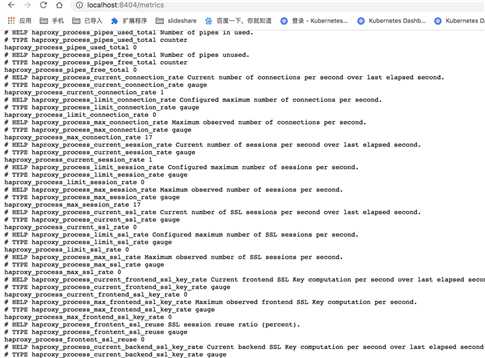
同时对于三个cortex 使用haproxy 做为push 以及查询接口的lb,同时基于prometheus 对于haproxy 进行监控(基于haproxy 2.0 提供的promettheus
支持),基于docker-compose 运行系统依赖的组件,详细配置参考 github
version: "3"
services:
haproxy:
image: haproxy:2.0.5-alpine
volumes:
- "./haproxy.cfg:/usr/local/etc/haproxy/haproxy.cfg"
ports:
- "8404:8404"
- "9009:9009"
consul:
image: consul
ports:
- "8500:8500"
cortex1:
image: cortexproject/cortex:master-7d13c2f0
command: -config.file=/etc/single-process-config.yaml -ring.store=consul -consul.hostname=consul:8500
ports:
- "9001:9009"
volumes:
- "./single-process-config.yaml:/etc/single-process-config.yaml"
cortex2:
image: cortexproject/cortex:master-7d13c2f0
command: -config.file=/etc/single-process-config.yaml -ring.store=consul -consul.hostname=consul:8500
ports:
- "9002:9009"
volumes:
- "./single-process-config.yaml:/etc/single-process-config.yaml"
cortex3:
image: cortexproject/cortex:master-7d13c2f0
command: -config.file=/etc/single-process-config.yaml -ring.store=consul -consul.hostname=consul:8500
ports:
- "9003:9009"
volumes:
- "./single-process-config.yaml:/etc/single-process-config.yaml"
granfan:
image: grafana/grafana
ports:
- "3000:3000"
node-exporter:
image: basi/node-exporter
ports:
- "9100:9100"
prometheus:
image: prom/prometheus
ports:
- "9090:9090"
volumes:
- "./prometheus.yml:/etc/prometheus/prometheus.yml"
# Configuration for running Cortex in single-process mode.
# This should not be used in production. It is only for getting started
# and development.
# Disable the requirement that every request to Cortex has a
# X-Scope-OrgID header. `fake` will be substituted in instead.
auth_enabled: false
server:
http_listen_port: 9009
# Configure the server to allow messages up to 100MB.
grpc_server_max_recv_msg_size: 104857600
grpc_server_max_send_msg_size: 104857600
grpc_server_max_concurrent_streams: 1000
?
distributor:
shard_by_all_labels: true
pool:
health_check_ingesters: true
ingester_client:
grpc_client_config:
# Configure the client to allow messages up to 100MB.
max_recv_msg_size: 104857600
max_send_msg_size: 104857600
use_gzip_compression: true
ingester:
#chunk_idle_period: 15m
lifecycler:
# The address to advertise for this ingester. Will be autodiscovered by
# looking up address on eth0 or en0; can be specified if this fails.
# address: 127.0.0.1
# We want to start immediately and flush on shutdown.
join_after: 0
claim_on_rollout: false
final_sleep: 0s
num_tokens: 512
# Use an in memory ring store, so we don‘t need to launch a Consul.
ring:
kvstore:
store: inmemory
replication_factor: 1
# Use local storage - BoltDB for the index, and the filesystem
# for the chunks.
schema:
configs:
- from: 2019-03-25
store: boltdb
object_store: filesystem
schema: v10
index:
prefix: index_
period: 168h
storage:
boltdb:
directory: /tmp/cortex/index
filesystem:
directory: /tmp/cortex/chunks
# my global config
global:
scrape_interval: 15s # Set the scrape interval to every 15 seconds. Default is every 1 minute.
evaluation_interval: 15s # Evaluate rules every 15 seconds. The default is every 1 minute.
# scrape_timeout is set to the global default (10s).
remote_write:
- url: http://haproxy:9009/api/prom/push
# Alertmanager configuration
alerting:
alertmanagers:
- static_configs:
- targets:
# - alertmanager:9093
?
# Load rules once and periodically evaluate them according to the global ‘evaluation_interval‘.
rule_files:
# - "first_rules.yml"
# - "second_rules.yml"
?
# A scrape configuration containing exactly one endpoint to scrape:
# Here it‘s Prometheus itself.
scrape_configs:
# The job name is added as a label `job=<job_name>` to any timeseries scraped from this config.
- job_name: ‘prometheus‘
?
# metrics_path defaults to ‘/metrics‘
# scheme defaults to ‘http‘.
?
static_configs:
- targets: [‘localhost:9090‘]
?
- job_name: ‘node-exporter‘
?
# metrics_path defaults to ‘/metrics‘
# scheme defaults to ‘http‘.
?
static_configs:
- targets: [‘node-exporter:9100‘]
?
- job_name: ‘haproxy-exporter‘
?
# metrics_path defaults to ‘/metrics‘
# scheme defaults to ‘http‘.
?
static_configs:
- targets: [‘haproxy:8404‘]
global
# master-worker required for `program` section
# enable here or start with -Ws
master-worker
mworker-max-reloads 3
# enable core dumps
set-dumpable
user root
stats socket /run/haproxy.sock mode 600 level admin
group root
log stdout local0
?
defaults
mode http
log global
timeout client 5s
timeout server 5s
timeout connect 5s
option redispatch
option httplog
?
resolvers dns
parse-resolv-conf
resolve_retries 3
timeout resolve 1s
timeout retry 1s
hold other 30s
hold refused 30s
hold nx 30s
hold timeout 30s
hold valid 10s
hold obsolete 30s
?
userlist api
user admin password $5$aVnIFECJ$2QYP64eTTXZ1grSjwwdoQxK/AP8kcOflEO1Q5fc.5aA
?
frontend stats
bind *:8404
# Enable Prometheus Exporter
http-request use-service prometheus-exporter if { path /metrics }
stats enable
stats uri /stats
stats refresh 10s
?
frontend fe_main
bind :9009
log-format "%ci:%cp [%tr] %ft %b/%s %TR/%Tw/%Tc/%Tr/%Ta %ST %B %CC %CS %tsc %ac/%fc/%bc/%sc/%rc %sq/%bq %hr %hs %{+Q}r cpu_calls:%[cpu_calls] cpu_ns_tot:%[cpu_ns_tot] cpu_ns_avg:%[cpu_ns_avg] lat_ns_tot:%[lat_ns_tot] lat_ns_avg:%[lat_ns_avg]"
default_backend be_main
?
backend be_main
# Enable Power of Two Random Choices Algorithm
balance random(2)
# Enable Layer 7 retries
retry-on all-retryable-errors
retries 3
server cortex1 cortex1:9009 check inter 2s
server cortex2 cortex2:9009 check inter 2s
server cortex3 cortex3:9009 check inter 2s
backend be_503
errorfile 503 /usr/local/etc/haproxy/errors/503.http
docker-compose up -d
主要是prometheus datasource 以及dashboard 的添加
datasource ,注意datasource 地址为cortex 通过haproxy lb 的地址 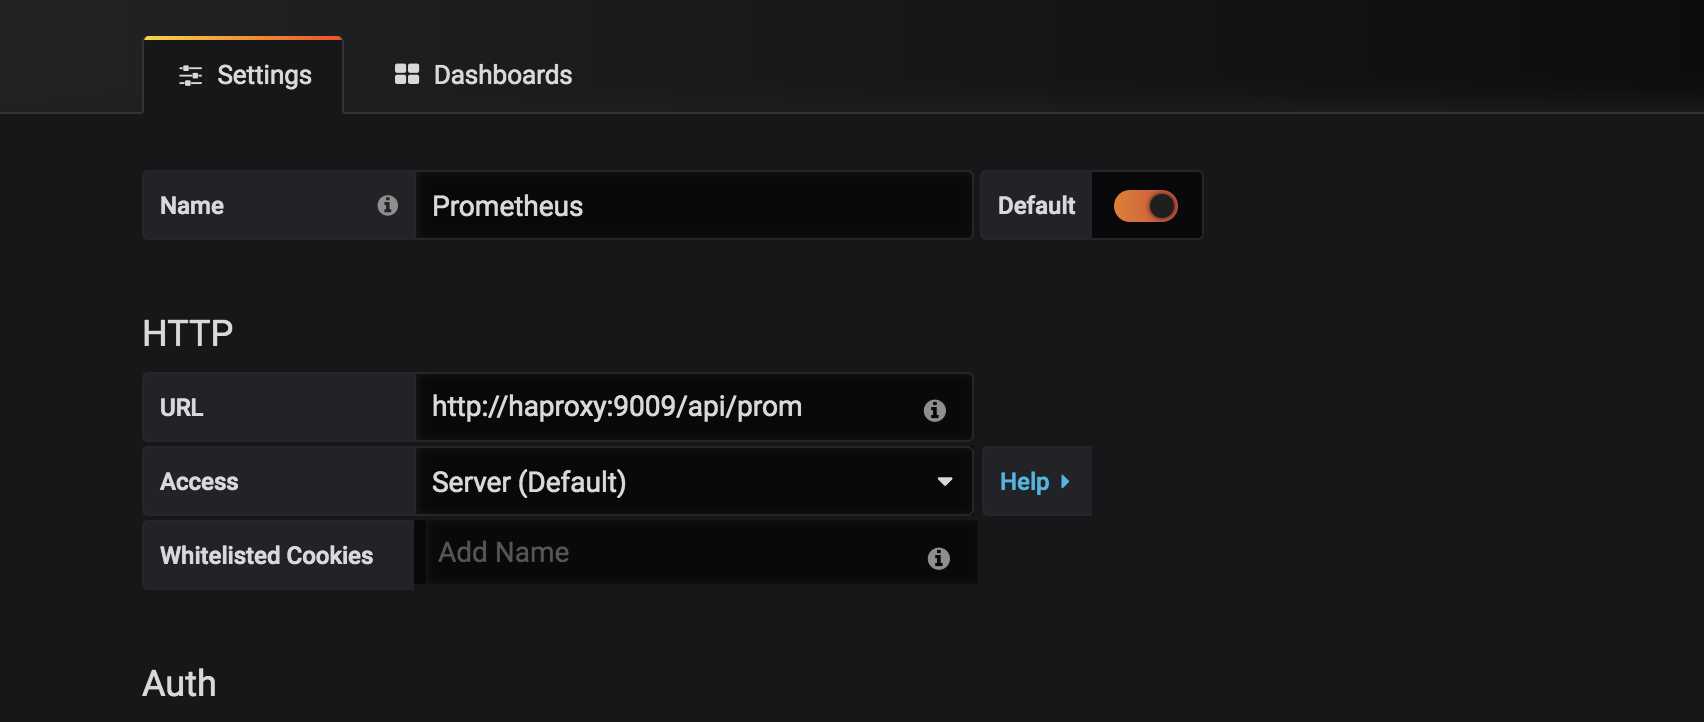
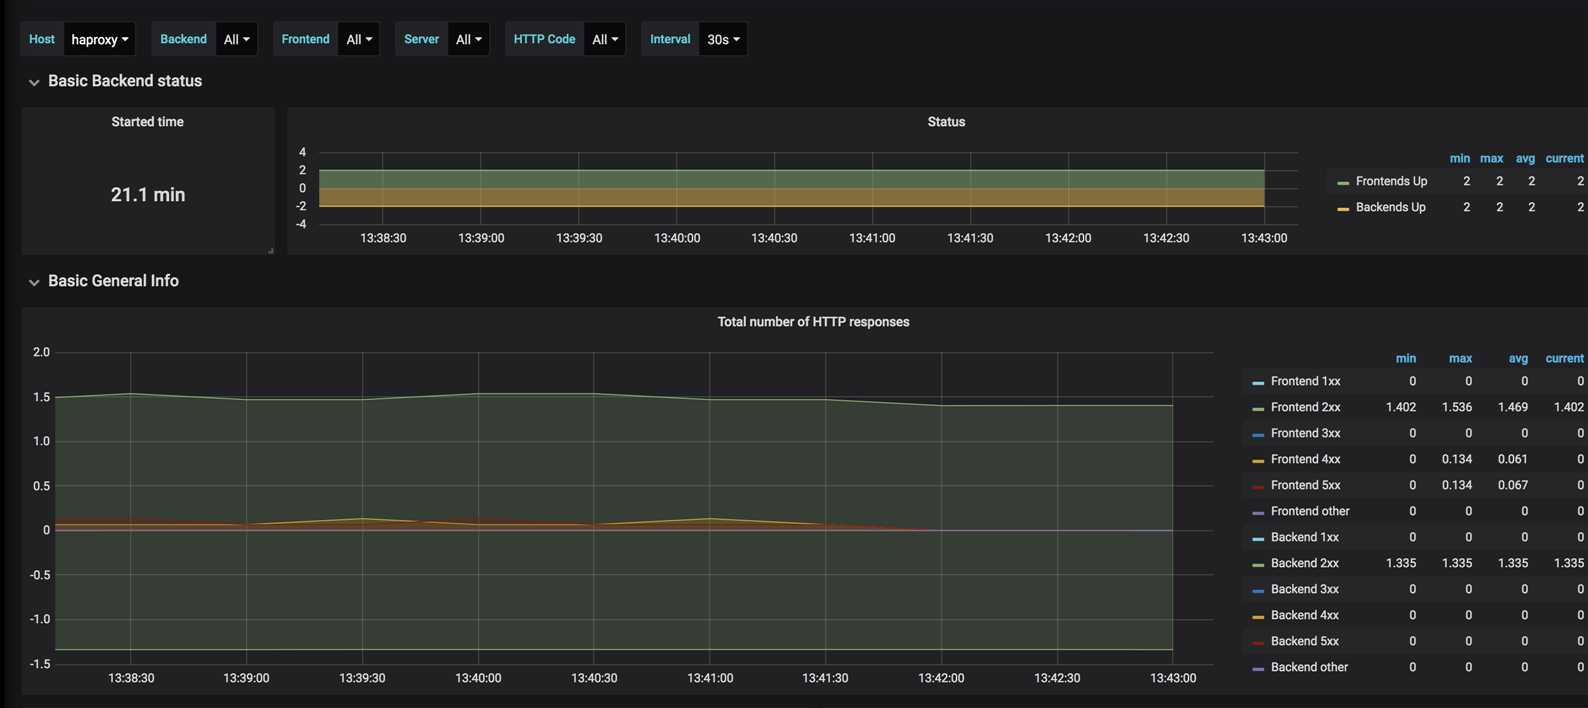
dashboard, 可以参考项目,直接导入node exporter以及haproxy 的metrics dashboard
独立 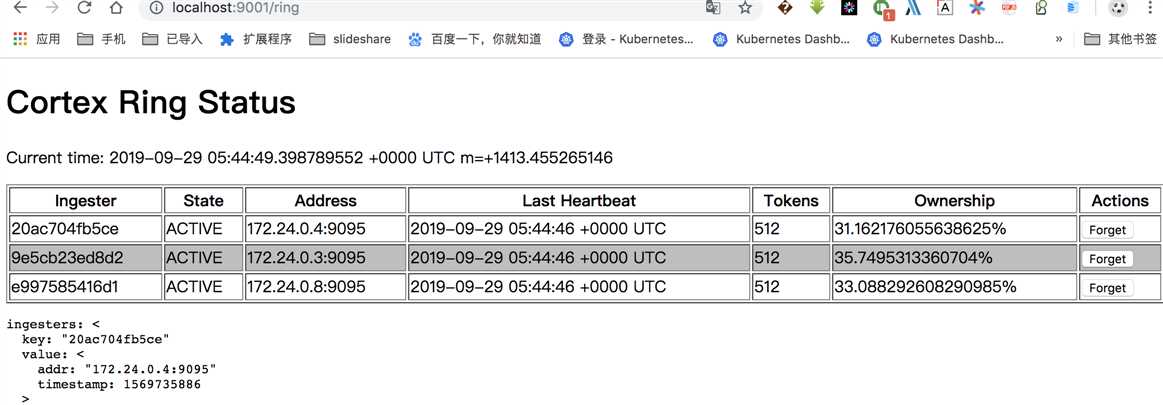
haproxy 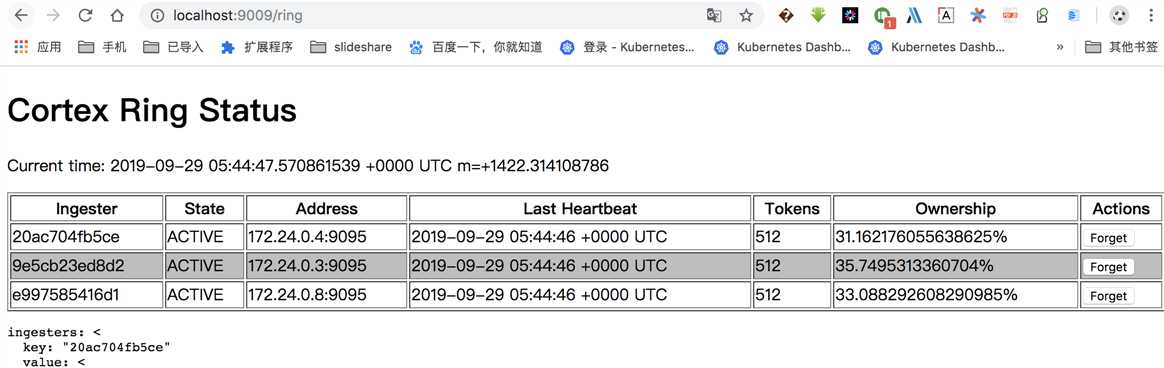
以上是一个简单的配置,实际上我们可以通过在cortex启动的时候指定-distributor.replication-factor=3 保证cortex 的ha,同时上边是比较简单的
实践,实际我们还需要其他后端存储做为数据的存储
https://github.com/cortexproject/cortex/blob/master/docs/getting_started.md
https://github.com/rongfengliang/cortex-docker-compose-running
原文:https://www.cnblogs.com/rongfengliang/p/11607479.html