参考书籍
《matlab 程序设计与综合应用》张德丰等著 感谢张老师的书籍,让我领略到matlab的便捷
《MATLAB技术大全》葛超等编著 感谢葛老师的书籍,让我领略到matlab的高效
t=0:pi/50:10*pi;
plot3(sin(t),cos(t),t,'g*')
grid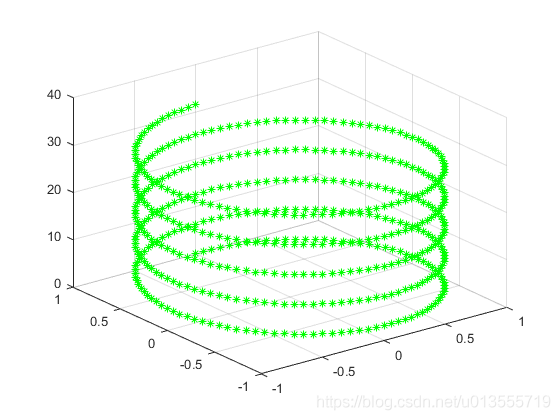
x=linspace(-2, 2, 20);      % 在x轴上取20点
y=linspace(-2, 2, 20);      %在y轴上取20点
[xx,yy]=meshgrid(x, y);     % xx和yy都是21x21的矩阵
zz=xx.*exp(-xx.^2-yy.^2);   % 计算函数值,zz也是21x21的矩阵
mesh(xx, yy, zz);          % 画出立体网状图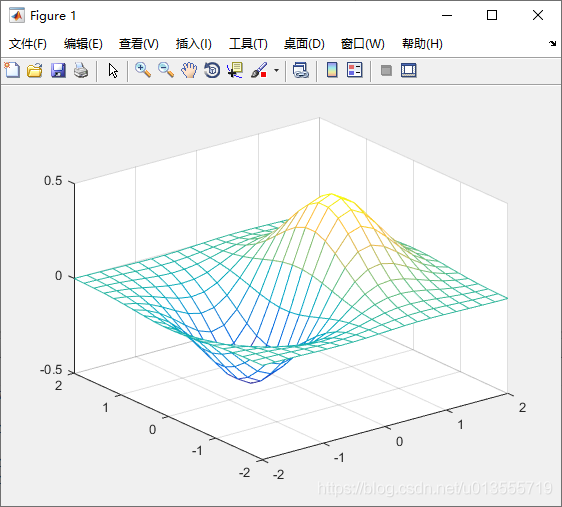
x=linspace(-2, 2, 20);      % 在x轴上取20点
y=linspace(-2, 2, 20);      %在y轴上取20点
[xx,yy]=meshgrid(x, y);     % xx和yy都是21x21的矩阵
zz=xx.*exp(-xx.^2-yy.^2);   % 计算函数值,zz也是21x21的矩阵
surf(xx, yy, zz);          % 画出立体曲面图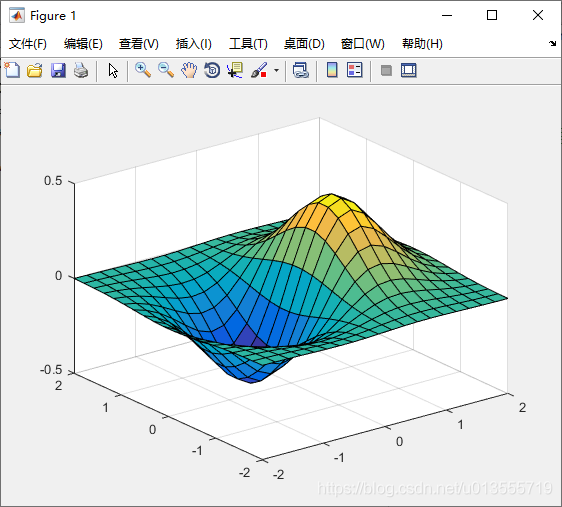
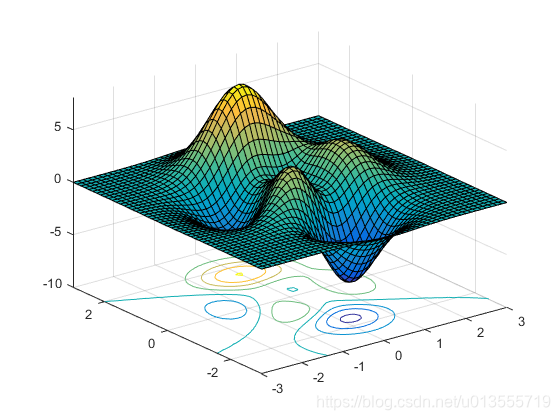
peaks % 最原始版本图形 F1
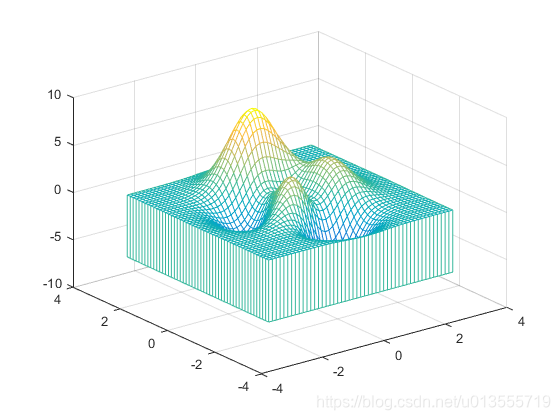
[x,y,z]=peaks;
figure;
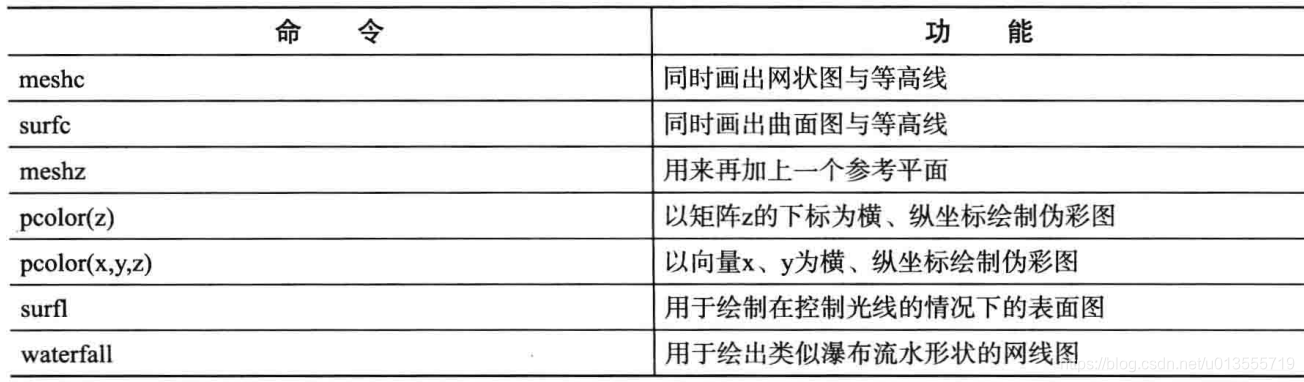
meshz(x,y,z); % 画上一个参考平面 F2
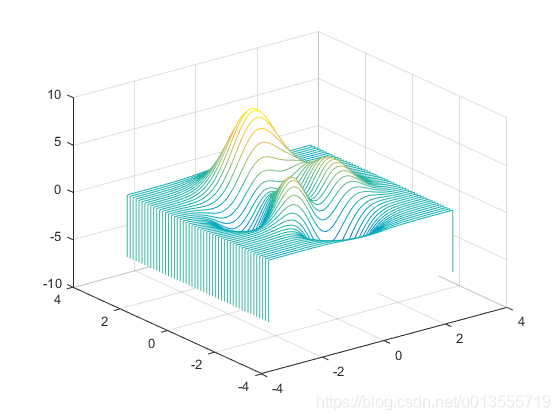
figure;
waterfall(x,y,z); % 瀑布流水形状网线图 F3
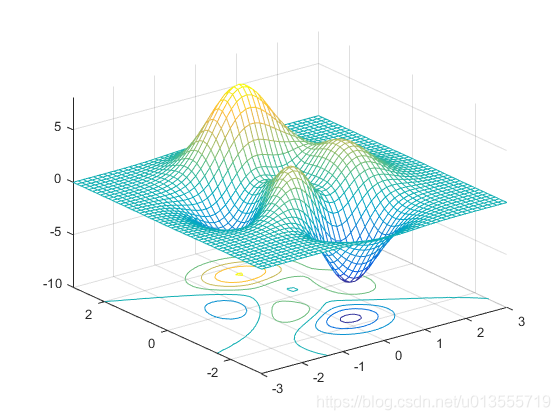
figure;
meshc(x,y,z); % 网格线和等高线 F4
figure;
surfc(x,y,z); % 同时画出曲面图和等高线图 F5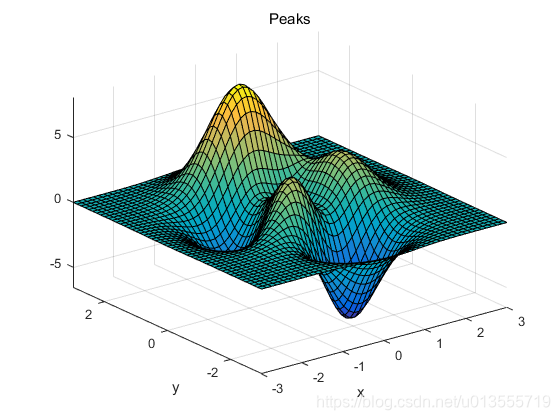
p=peaks;    %peaks 为系统提供的多峰函数
subplot(2,2,1);
mesh(peaks,p);
view(-37.5,30);  %指定子图 1 的视点
title('azimuth=-37.5,elevation=30');
subplot(2,2,2);
mesh(peaks,p);
view(-17,60);   %指定子图 2的视点
title('azimuth=-17,elevation=60');
subplot(2,2,3);
mesh(peaks,p);
view(-90,0);    %指定子图 3 的视点
title('azimuth=-90,elevation=0');
subplot(2,2,4);
mesh(peaks,p);
view(-7,-10);    %指定子图 4的视点
title('azimuth=-7,elevation=10')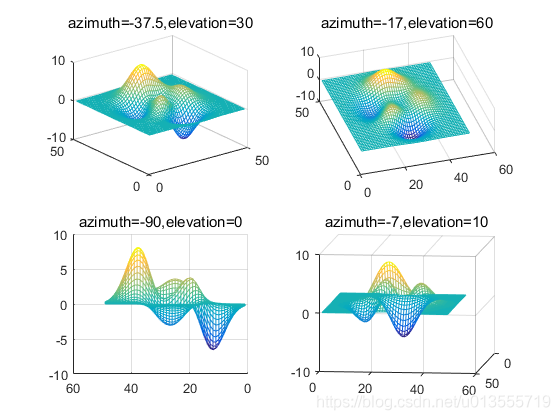
x= -1.5:0.2:1.5;y=-1:0.2:1;
[X,Y]=meshgrid(x,y);
Z=sqrt(4-X.^2/9-Y.^2/4);
view(45,45)
subplot(2,2,1);surfl(X,Y,Z, [0,45],[.1  .6  .4  10]);
shading interp
subplot(2,2,2);surfl(X,Y,Z, [20,45],[.3  .6  .4  10]);
shading interp
subplot(2,2,3);surfl(X,Y,Z, [40,45],[.6  .6  .4  10]);
shading interp
subplot(2,2,4);surfl(X,Y,Z, [60,45],[.9  .6  .4  10]);
shading interp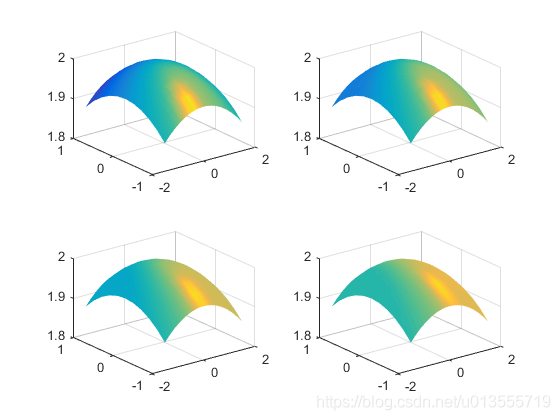
[x,y,z]=sphere(20);
subplot(1,2,1);
surf(x,y,z);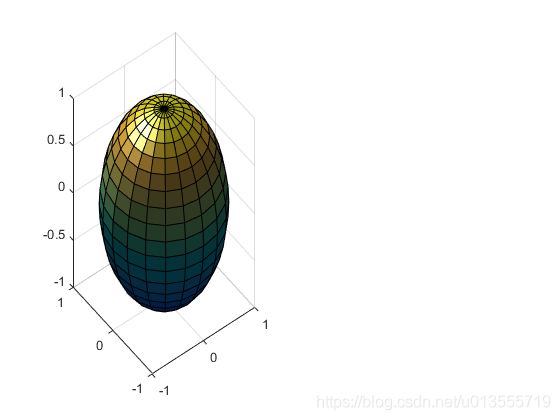
[x,y,z]=sphere(20);
subplot(1,2,1);
surf(x,y,z);
axis equal; % 横轴纵轴的坐标定标系数设为相同值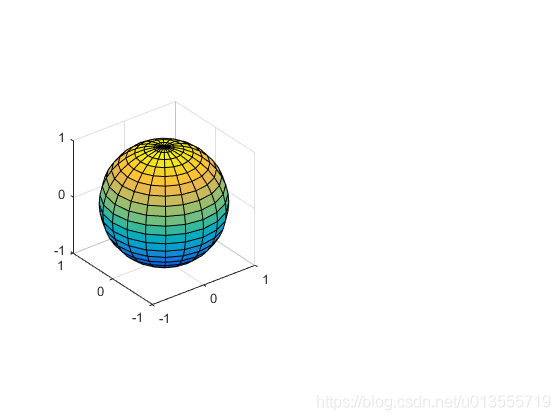
[x,y,z]=sphere(20);
subplot(1,2,1);
surf(x,y,z);
axis equal; % 横轴纵轴的坐标定标系数设为相同值
light('Posi',[1,1,1]);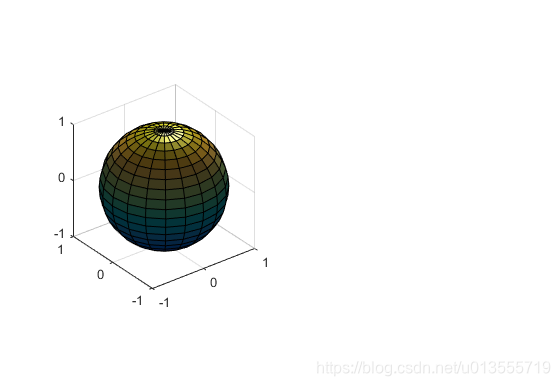
[x,y,z]=sphere(20);
subplot(1,2,1);
surf(x,y,z);
axis equal; % 横轴纵轴的坐标定标系数设为相同值
light('Posi',[-1,-1,0]);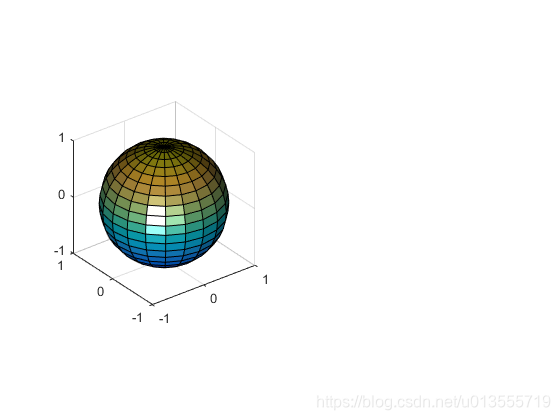
[x,y,z]=sphere(20);
subplot(1,2,1);
surf(x,y,z);
axis equal; % 横轴纵轴的坐标定标系数设为相同值
light('Posi',[-1,-1,0]);
shading interp;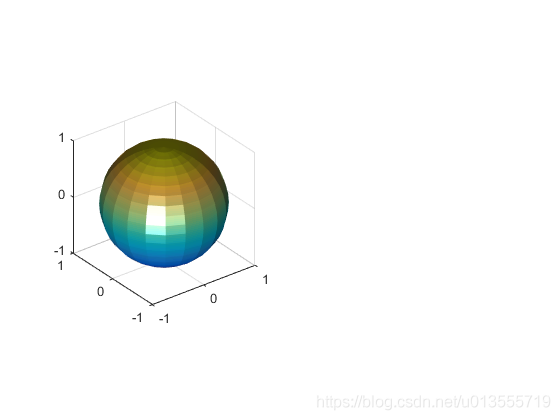
plot3(0,1,1,'*');
text(0,1,1,' light');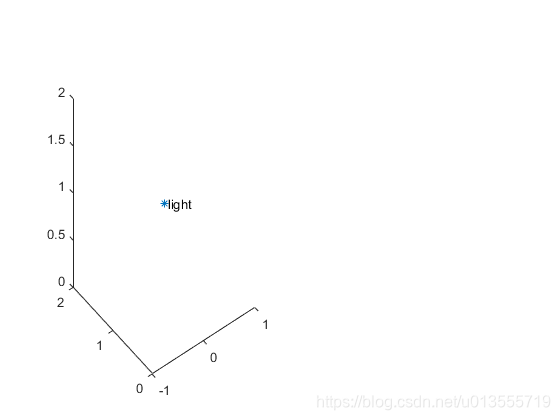
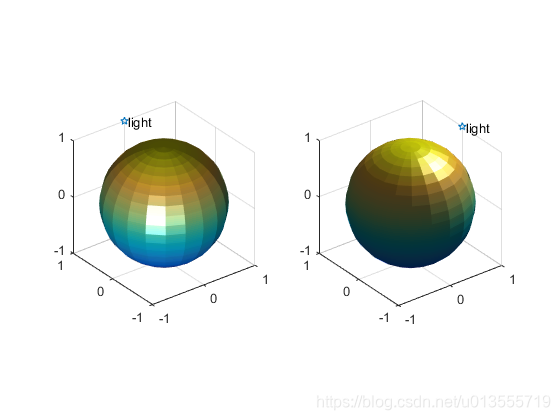
[x,y,z]=sphere(20);
subplot(1,2,1);
surf(x,y,z);
axis equal; % 横轴纵轴的坐标定标系数设为相同值
light('Posi',[-1,-1,0]); % 灯光位置
shading interp; % 光滑
hold on;
plot3(0,1,1,'p');
text(0,1,1,' light');
subplot(1,2,2);
surf(x,y,z);
axis equal;
light('Posi',[1,0,1]); % 灯光位置
shading interp; % 光滑
hold on;
plot3(1,0,1,'p');
text(1,0,1,' light');figure
subplot(2,2,1)
[x,y,z]=cylinder(3,2)
surf(x,y,z)
subplot(2,2,2)
[x,y,z]=cylinder(3,3)
surf(x,y,z)
subplot(2,2,3)
[x,y,z]=cylinder(3,4)
surf(x,y,z)
subplot(2,2,4)
t=0:pi/10:2*pi;
[X,Y,Z]=cylinder(2+cos(t),30);
surf(X,Y,Z)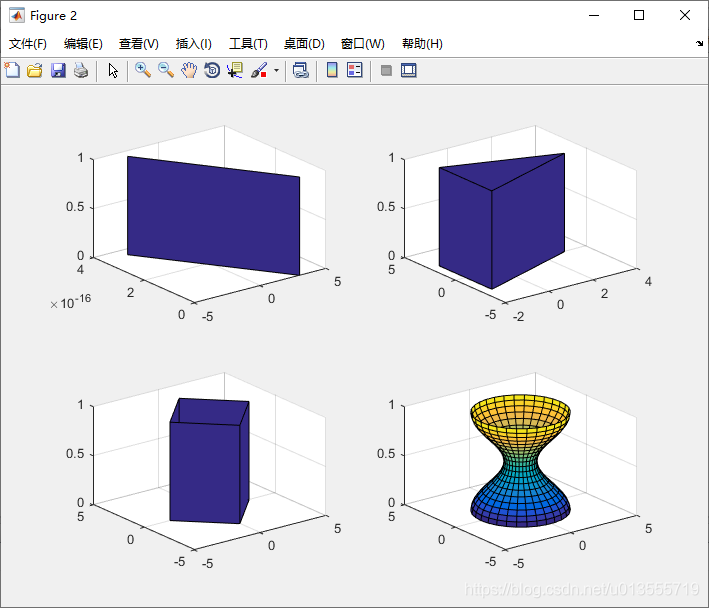
figure
subplot(2,2,1)
[x,y,z]=sphere(100)
surf(x,y,z)
subplot(2,2,2)
[x,y,z]=sphere(100)
plot3(x,y,z)
subplot(2,2,3)
[x,y,z]=sphere(100)
surfl(x,y,z)
subplot(2,2,4)
[x,y,z]=sphere(100)
mesh(x,y,z)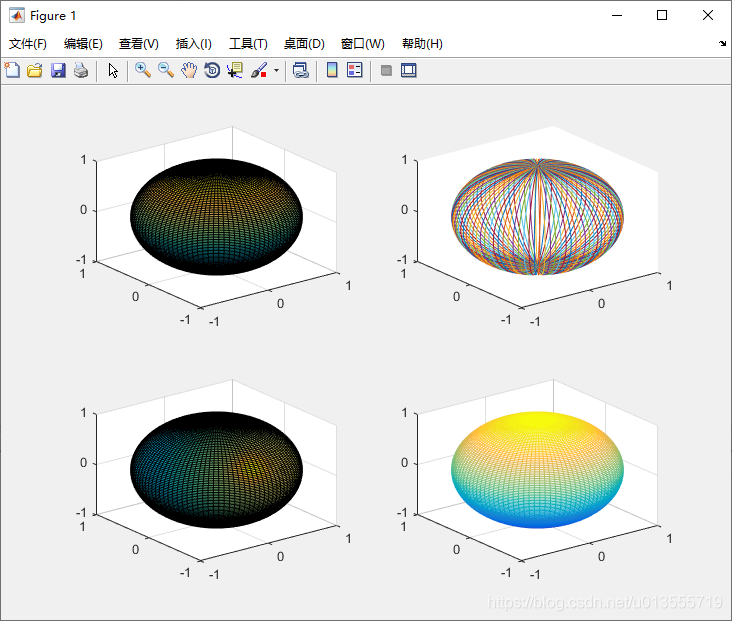
原文:https://www.cnblogs.com/cloud-ken/p/11699933.html