This example showcases a simple horizontal bar chart
import matplotlib.pyplot as plt
import numpy as np

# Fixing random state for reproducibility
np.random.seed(19680801)


plt.rcdefaults()
fig, ax = plt.subplots()

# Example data
people = ('Tom', 'Dick', 'Harry', 'Slim', 'Jim')
y_pos = np.arange(len(people))
performance = 3 + 10 * np.random.rand(len(people))
error = np.random.rand(len(people))

ax.barh(y_pos, performance, xerr=error, align='center')
ax.set_yticks(y_pos)
ax.set_yticklabels(people)
ax.invert_yaxis()  # labels read top-to-bottom
ax.set_xlabel('Performance')
ax.set_title('How fast do you want to go today?')

plt.show()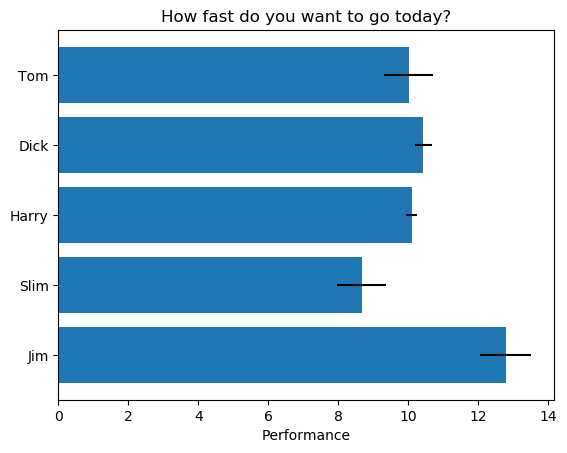
使用seed(value)之后调用np.random.randn()或np.random.rand()可以产生固定的随机值
# 使用seed设置随机种子
np.random.seed(19680801)
print(np.random.randn(2,5), end='\n\n')

# 不设置随机种子
print(np.random.randn(2,5), end='\n\n')

# 设置相同的随机种子
np.random.seed(19680801)
print(np.random.randn(2,5))
[[ 1.04930431 0.86609917 0.5511346 1.72807779 -0.64928812]
[-0.47841958 1.07788511 0.96881033 -0.80934479 -1.2373891 ]]
[[ 1.86011654 -0.30831924 0.78297055 0.02152345 0.71566379]
[ 1.40146651 -1.12750212 1.65581822 1.40096148 0.20199007]]
[[ 1.04930431 0.86609917 0.5511346 1.72807779 -0.64928812]
[-0.47841958 1.07788511 0.96881033 -0.80934479 -1.2373891 ]]matplotlib.rcParams字典修改所有已经加载的配置项matplotlib.rc(*args,**kwargs)来修改配置项,其中args是你要修改的属性,kwargs是属性的关键字属性matplotlib.rcdefaults()将所有配置重置为标准设置import matplotlib
print(matplotlib.rcParams['animation.embed_limit'])
matplotlib.rcParams['animation.embed_limit'] = 10
print(matplotlib.rcParams['animation.embed_limit'])
matplotlib.rc('animation', embed_limit=15)
print(matplotlib.rcParams['animation.embed_limit'])
matplotlib.rcdefaults()
print(matplotlib.rcParams['animation.embed_limit'])20.0
10.0
15.0
20.0| Parameters | Meaning |
|---|---|
| y(标量或向量) | 每个bar的y坐标 |
| width(标量或向量) | 每个bar的宽度 |
| height | 每个bar的高度 |
| left(向量) | bar左侧基坐标 |
| align | 可以是‘center‘或‘edge‘,表示bar和y轴ticks之间的位置关系 |
# Fixing random state for reproducibility
np.random.seed(19680801)

# plt.rcdefaults()
fig, ax = plt.subplots()

# Example data
people = ('Tom', 'Dick', 'Harry', 'Slim', 'Jim')
y_pos = np.arange(len(people))
performance = 3 + 10 * np.random.rand(len(people))
error = np.random.rand(len(people))

#使用height和left控制bar的宽度和左侧坐标,color设置bar的颜色,align设置bar和ytick的对齐方式
ax.barh(y_pos, performance, [0.5, 0.8, 0.3, 0.6, 0.2], [2, 3, 5, 4, 1],
        xerr=error, align='edge', color="#84D096")
ax.set_yticks(y_pos)
ax.set_yticklabels(people)
ax.invert_yaxis()  # labels read top-to-bottom
ax.set_xlabel('Performance')
ax.set_title('How fast do you want to go today?')

plt.show()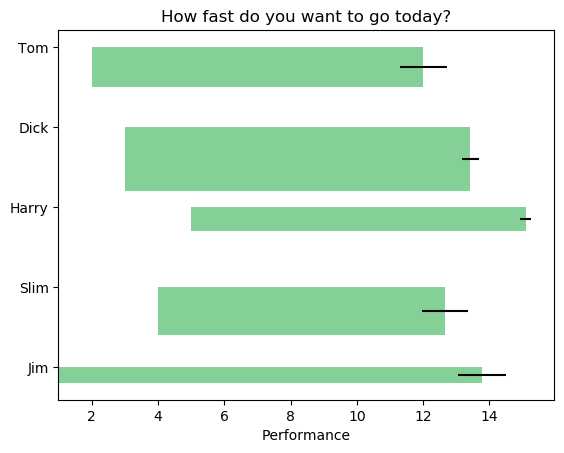
原文:https://www.cnblogs.com/wndf6122/p/11701485.html