代码如下:
import cv2
import numpy as np
import matplotlib.pyplot as plt
img = cv2.imread(‘C:\\Users\\admin\\Desktop\\original_img3\\testimg\\messi.jpg‘)
_, _, colorChannel = img.shape
color = [‘B‘, ‘G‘, ‘R‘]
plt.figure()
for i in range(colorChannel):
hist_img, _ = np.histogram(img[:, :, i], 256)
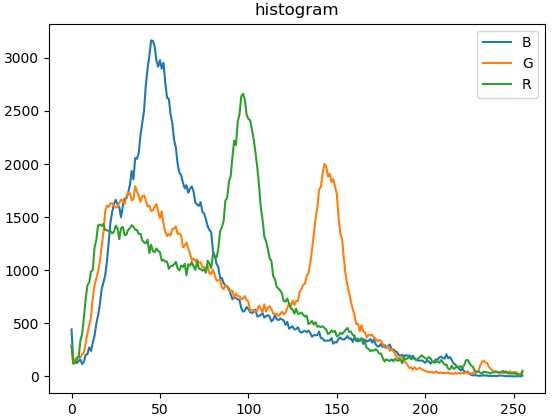
plt.plot(range(256), hist_img, label=color[i])
plt.legend(loc=‘best‘)
plt.title(‘histogram‘)
plt.figure()
for i in range(colorChannel):
hist_img, _ = np.histogram(img[:, :, i], 256)
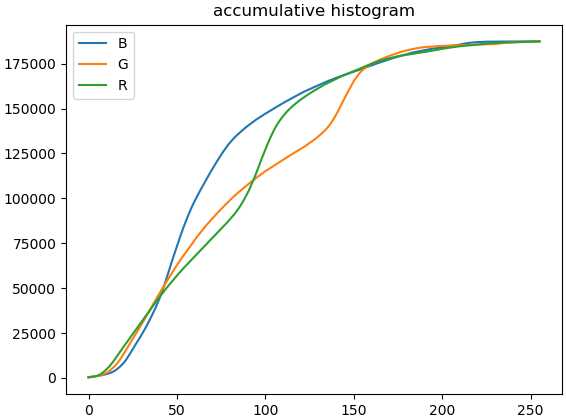
cdf_img = np.cumsum(hist_img) # accumulative histogram
plt.plot(range(256), cdf_img, label=color[i])
plt.legend(loc=‘best‘)
plt.title(‘accumulative histogram‘)
效果如下:
原文:https://www.cnblogs.com/picassooo/p/11824972.html