<template>
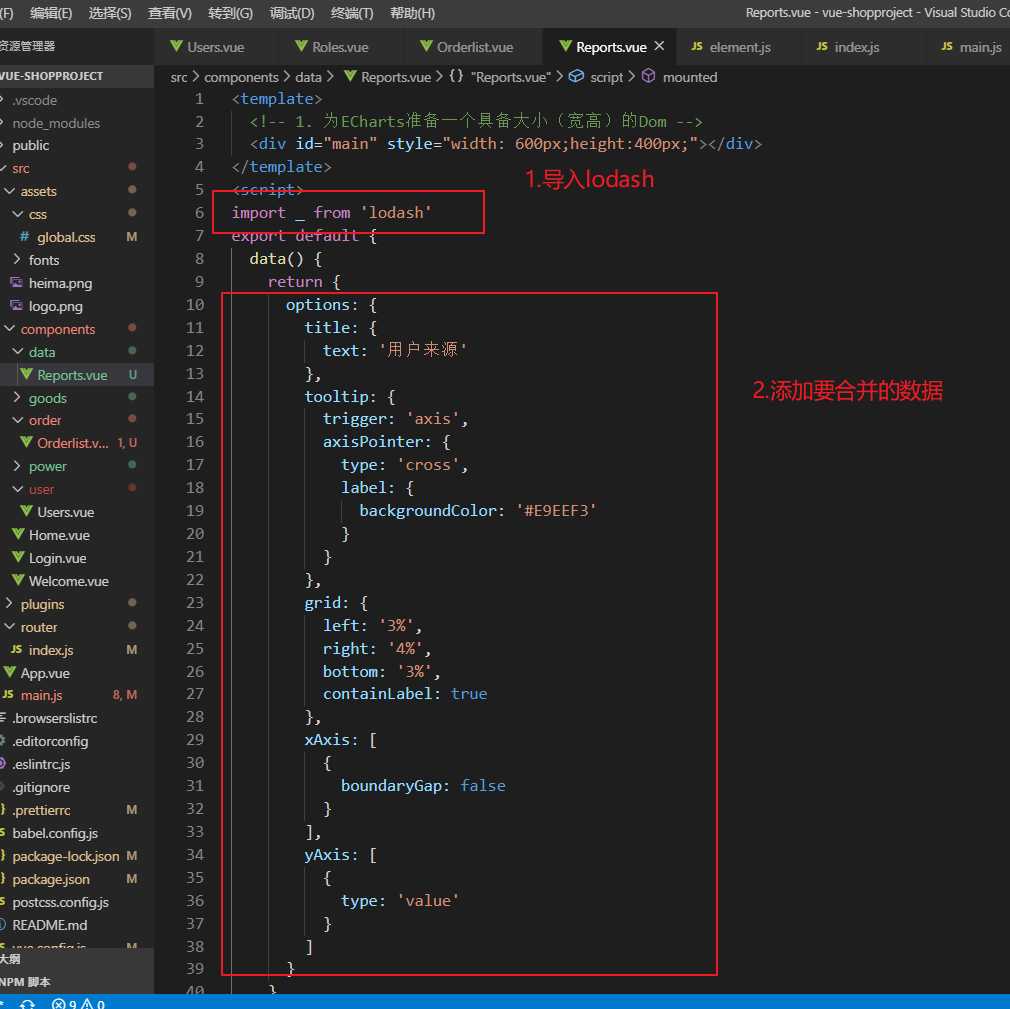
<!-- 1. 为ECharts准备一个具备大小(宽高)的Dom -->
<div id="main" style="width: 600px;height:400px;"></div>
</template>
<script>
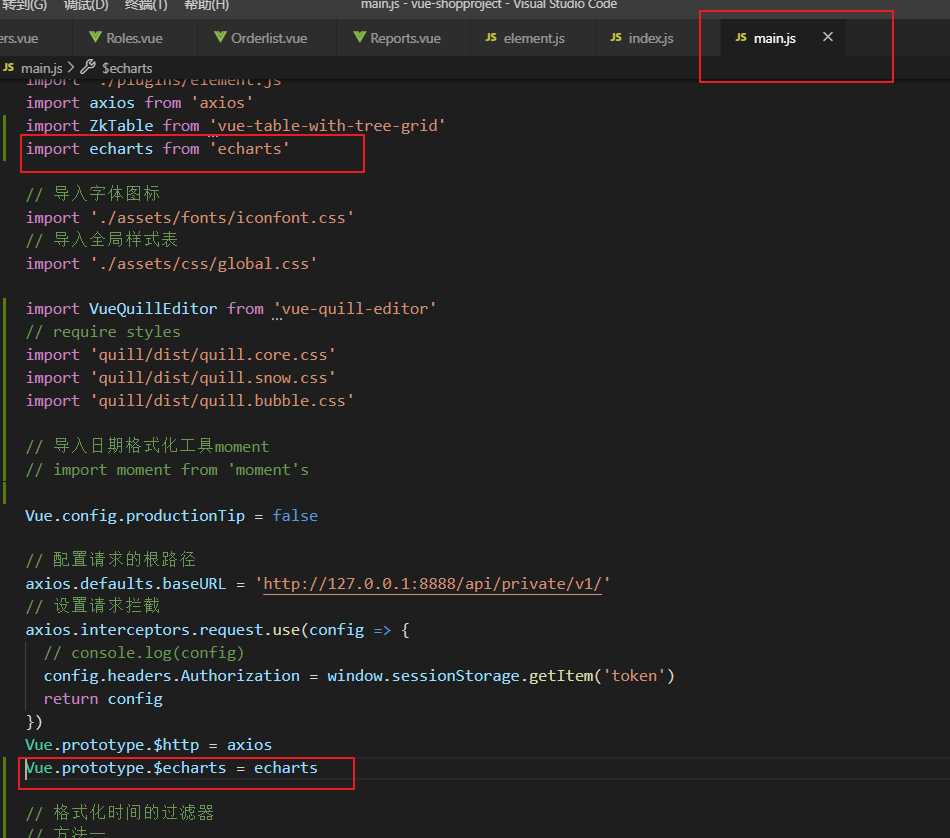
import _ from ‘lodash‘
export default {
data() {
return {
options: {
title: {
text: ‘用户来源‘
},
tooltip: {
trigger: ‘axis‘,
axisPointer: {
type: ‘cross‘,
label: {
backgroundColor: ‘#E9EEF3‘
}
}
},
grid: {
left: ‘3%‘,
right: ‘4%‘,
bottom: ‘3%‘,
containLabel: true
},
xAxis: [
{
boundaryGap: false
}
],
yAxis: [
{
type: ‘value‘
}
]
}
}
},
methods: {},
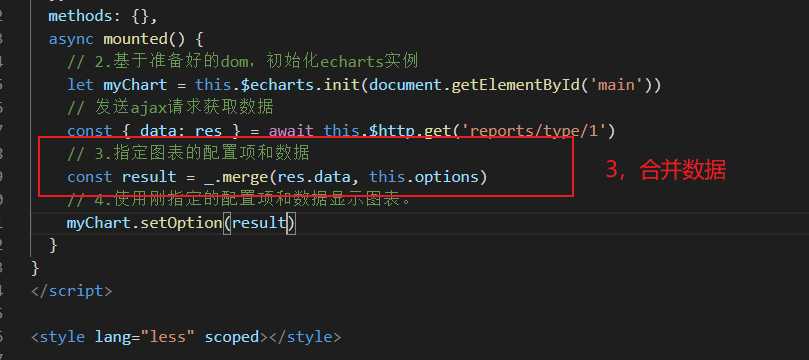
async mounted() {
// 2.基于准备好的dom,初始化echarts实例
let myChart = this.$echarts.init(document.getElementById(‘main‘))
// 发送ajax请求获取数据
const { data: res } = await this.$http.get(‘reports/type/1‘)
// 3.指定图表的配置项和数据
const result = _.merge(res.data, this.options)
// 4.使用刚指定的配置项和数据显示图表。
myChart.setOption(result)
}
}
</script>
<style lang="less" scoped></style>