本文翻译自:Qingkai‘s Blog
当使用python的Basemap库绘制地图时,选择一个漂亮的底图会为图片增色不少,但是使用map.bluemarble()、map.etopo()或者map.shadedrelief()等函数时,由于分辨率的原因,将图片缩小到较小范围会使得底图非常模糊。其实,创建一个高分辨率的底图的方式时使用arcgisimage方法。您可以在这里看到Basemap的详细说明。我将在下边的例子当中展示几个非常漂亮的例子。
为了使用arcgisimage方法,你需要为不同的区域指定不同的epsg,并从以下列表中选择相应的服务(不同的服务请参考这里和这里):
你会喜欢哪个底图呢?你可以在Qingkai’s Github下载脚本文件
In [1]:
 1 from mpl_toolkits.basemap import Basemap
 2 import matplotlib.pyplot as plt
 3
 4 # let‘s first define a helper function to plot the map of Bay Area in US.
 5
 6 def plot_map(service = ‘World_Physical_Map‘, epsg = 4269, xpixels = 5000):
 7     # note, you need change the epsg for different region,
 8     #US is 4269, and you can google the region you want
 9     plt.figure(figsize = (8, 8))
10     m = Basemap(projection=‘mill‘,llcrnrlon=-123. ,llcrnrlat=37,
11         urcrnrlon=-121 ,urcrnrlat=39, resolution = ‘l‘, epsg = epsg)
12
13     # xpixels controls the pixels in x direction, and if you leave ypixels
14     # None, it will choose ypixels based on the aspect ratio
15     m.arcgisimage(service=service, xpixels = xpixels, verbose= False)
16
17     plt.show()
In [2]:
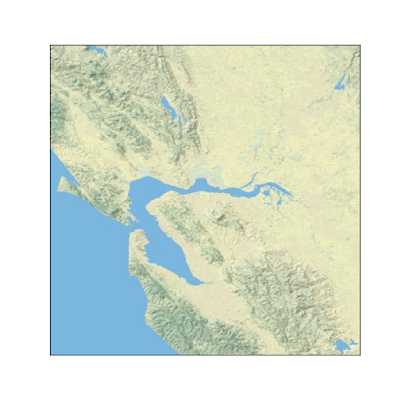
plot_map(service = ‘World_Physical_Map‘, epsg = 4269)
In [3]:
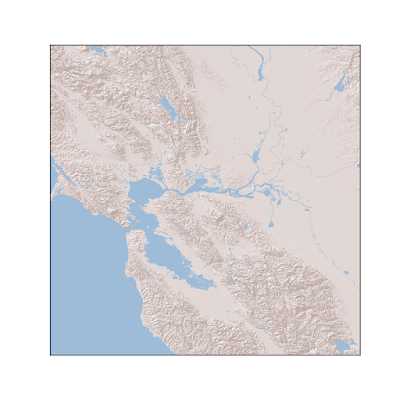
plot_map(service=‘World_Shaded_Relief‘)
In [4]:
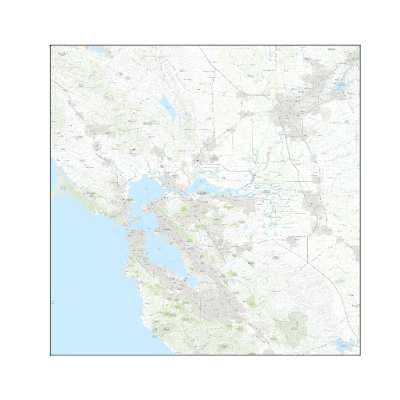
plot_map(service=‘World_Topo_Map‘)
In [5]:
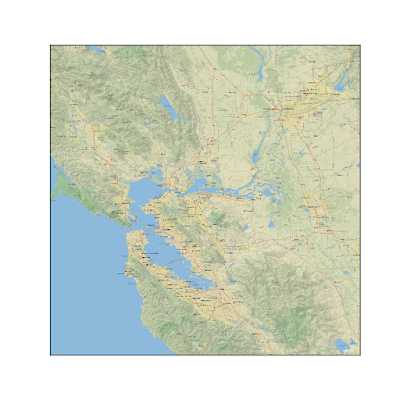
plot_map(service=‘NatGeo_World_Map‘)
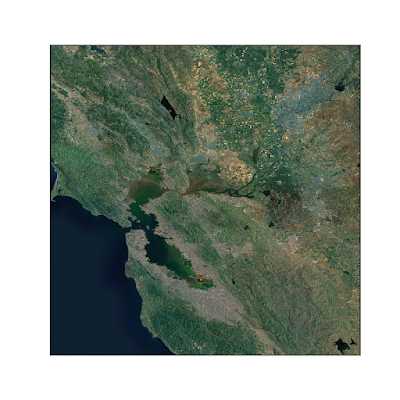
In [6]:
plot_map(service=‘ESRI_Imagery_World_2D‘)
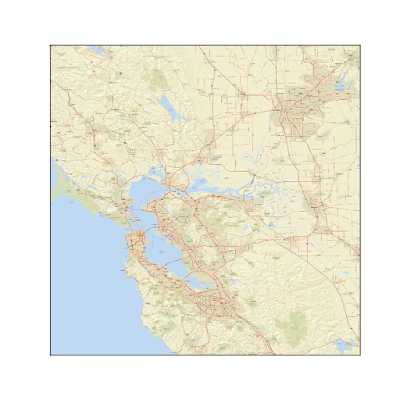
In [7]:
plot_map(service=‘World_Street_Map‘)
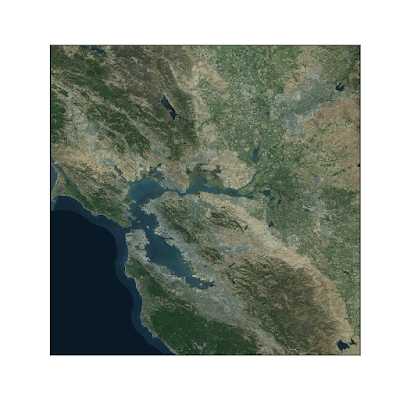
In [8]:
plot_map(service=‘World_Imagery‘)
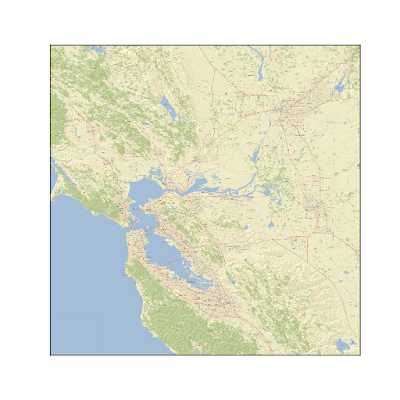
In [9]:
plot_map(service=‘ESRI_StreetMap_World_2D‘)
原文:https://www.cnblogs.com/keeptg/p/11973968.html