准备工作 1.准备两台虚拟机(我的是centos7系统的)
一台是 192.168.18.140
一台是 192.168.18.141
2.关闭防火墙 和SELinux
|
1
2
|
systemctl stop firewalldsetenforce 0 |
优化系统
|
1
2
3
4
5
6
7
|
vim /etc/security/limits.conf********************************* soft nproc 65535* hard nproc 65535* soft nofile 65535* hard nofile 65535******************************** |
测试是否优化系统完成 断开连接重新连接一下如下所示 就可以了
|
1
2
|
[root@localhost ~]# ulimit -n65535 |
这两台服务器都需要安装jdk环境
|
1
2
3
4
5
6
7
8
9
10
11
12
13
14
|
[root@localhost src]# rpm -ivh jdk-8u131-linux-x64_.rpm准备中... ################################# [100%]正在升级/安装... 1:jdk1.8.0_131-2000:1.8.0_131-fcs ################################# [100%]Unpacking JAR files... tools.jar... plugin.jar... javaws.jar... deploy.jar... rt.jar... jsse.jar... charsets.jar... localedata.jar...[root@localhost src]# |
140 服务器是ES+kibana
先安装ES(elasticsearch)
|
1
2
3
4
5
6
7
8
9
10
11
12
13
|
[root@localhost src]# rpm -ivh elasticsearch-6.6.2.rpm警告:elasticsearch-6.6.2.rpm: 头V4 RSA/SHA512 Signature, 密钥 ID d88e42b4: NOKEY准备中... ################################# [100%]Creating elasticsearch group... OKCreating elasticsearch user... OK正在升级/安装... 1:elasticsearch-0:6.6.2-1 ################################# [100%]### NOT starting on installation, please execute the following statements to configure elasticsearch service to start automatically using systemd sudo systemctl daemon-reload sudo systemctl enable elasticsearch.service### You can start elasticsearch service by executing sudo systemctl start elasticsearch.serviceCreated elasticsearch keystore in /etc/elasticsearch<br> |
编辑elasticesarch的配置文件
|
1
2
3
4
5
|
vim /etc/elasticsearch/elasticsearch.yml修改以下内容network.host: 192.168.18.140 //修改为本机IP地址http.port: 9200<br><br>systemctl restart elasticsearch |
开始安装kibana
|
1
2
3
4
5
|
rpm -ivh kibana-6.6.2-x86_64.rpm警告:kibana-6.6.2-x86_64.rpm: 头V4 RSA/SHA512 Signature, 密钥 ID d88e42b4: NOKEY准备中... ################################# [100%]正在升级/安装... 1:kibana-6.6.2-1 ################################# [100%] |
编辑kibana的配置文件
|
1
2
3
4
5
6
7
8
|
修改成如下所示就可以了cat /etc/kibana/kibana.yml |grep -v ‘^#‘*****************************************server.port: 5601server.host: "0.0.0.0"elasticsearch.hosts: ["http://192.168.18.140:9200"]***************************************** |
重启kibana
sysetmct restart kibana
给予权限
chmod -R 777 /var/log/messages
141 服务器是logstash
安装
|
1
2
3
4
5
6
7
|
rpm -ivh logstash-6.6.0.rpm警告:logstash-6.6.0.rpm: 头V4 RSA/SHA512 Signature, 密钥 ID d88e42b4: NOKEY准备中... ################################# [100%]正在升级/安装... 1:logstash-1:6.6.0-1 ################################# [100%]Using provided startup.options file: /etc/logstash/startup.optionsSuccessfully created system startup script for Logstash |
编写一个收集日志的配置文件
|
1
2
3
4
5
6
7
8
9
10
11
12
13
14
15
16
|
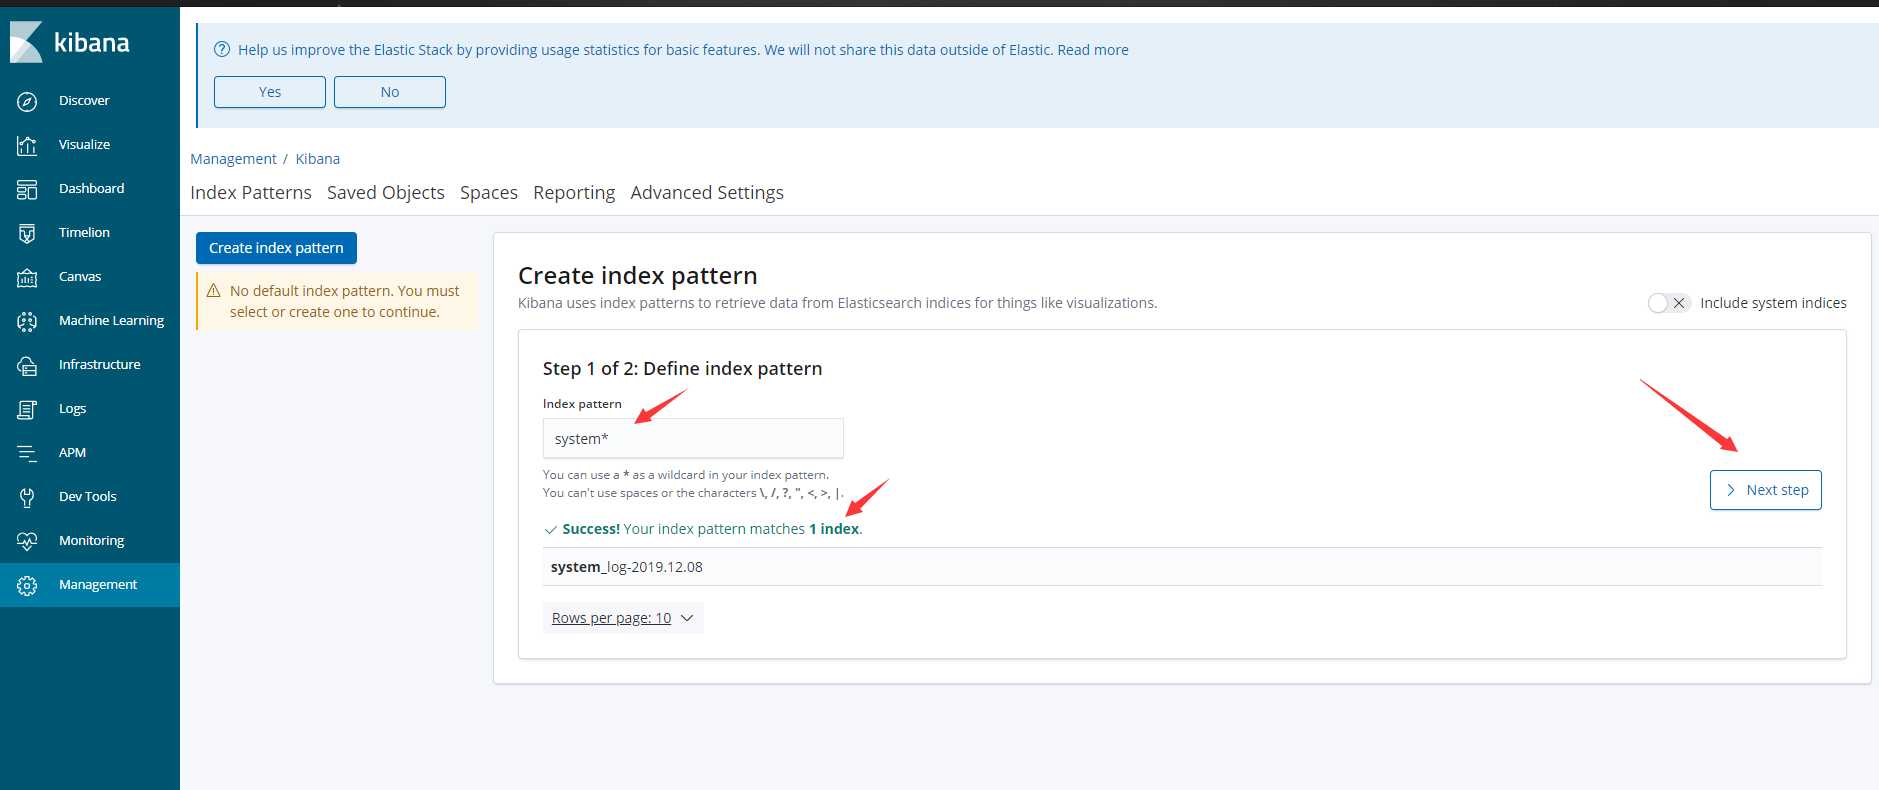
vim /etc/logstash/conf.d/system.conf*******************************************input { file { path => "/var/log/messages" type => "system-log" start_position => "beginning" }}output { elasticsearch { hosts => "192.168.18.140:9200" index => "system_log-%{+YYYY.MM.dd}" }}******************************************* <br>重启服务<br>systemctl restart logstash |
给予权限
chmod -R 777 /var/log/messages
执行 这条命令 curl -X GET HTTP://192.168.18.140:9200/_cat/indices?v 如下所示表示成功可以检索 在两台服务器上都执行以下这条命令
|
1
2
3
|
health status index uuid pri rep docs.count docs.deleted store.size pri.store.sizegreen open .kibana_1 JK3lTv0uSw2ewk3_Qvwmww 1 0 2 0 8.6kb 8.6kbyellow open system_log-2019.12.08 12ezV-ilT9uIU7if-xIATw 5 1 328 0 189.2kb 189.2kb |
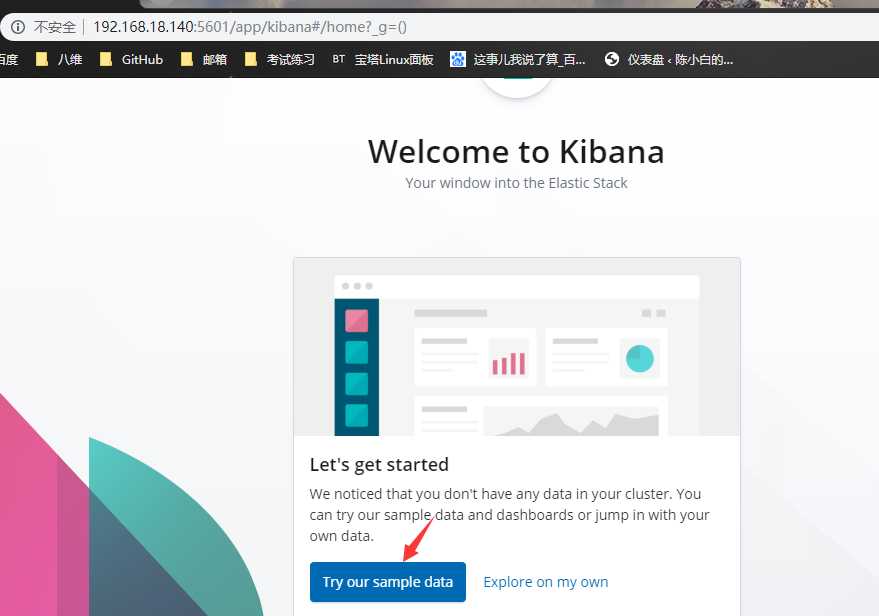
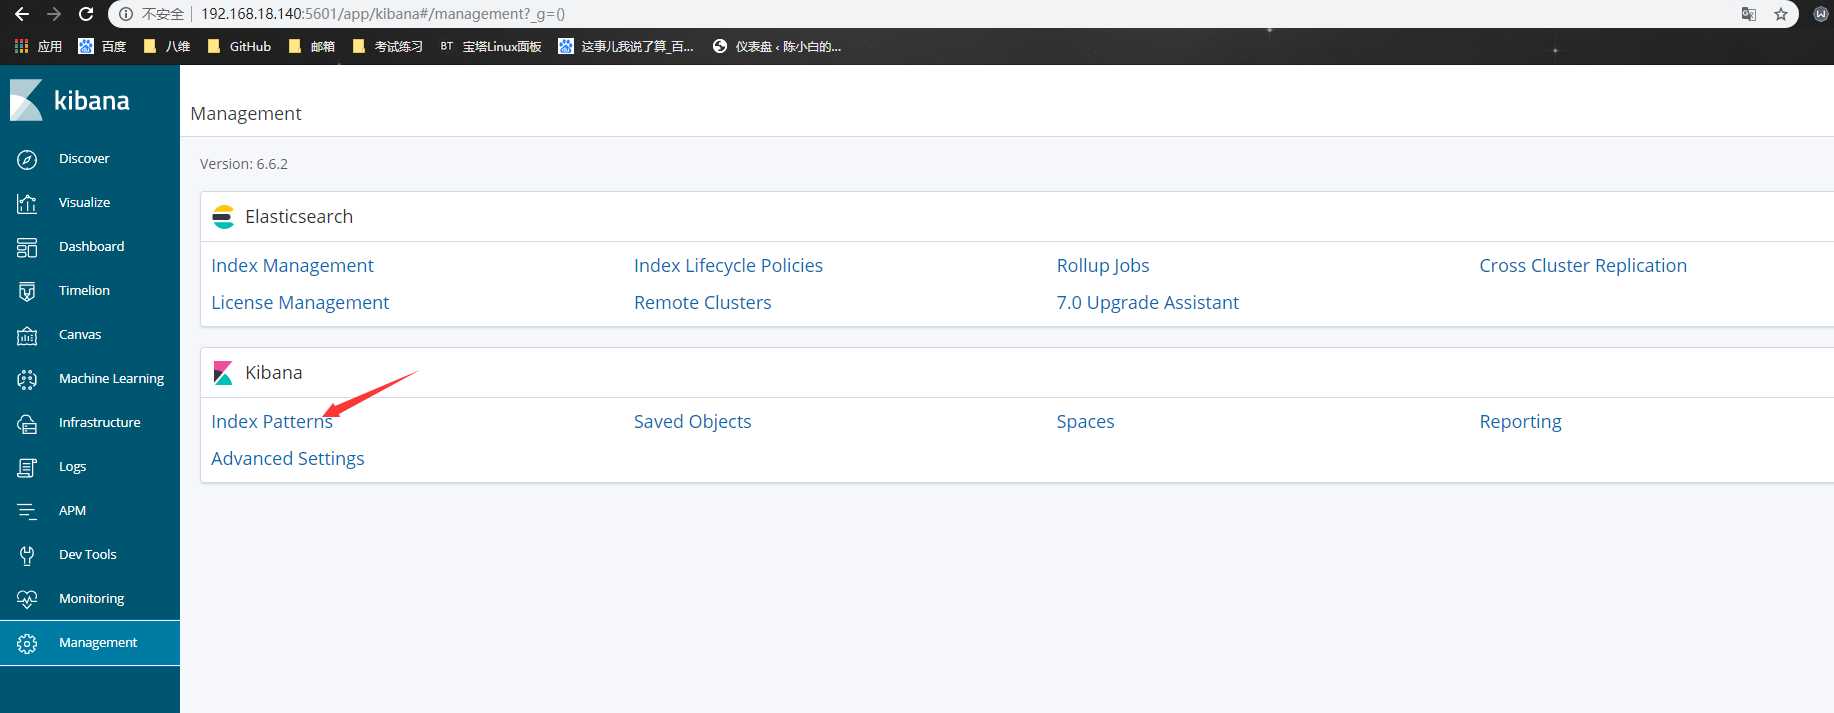
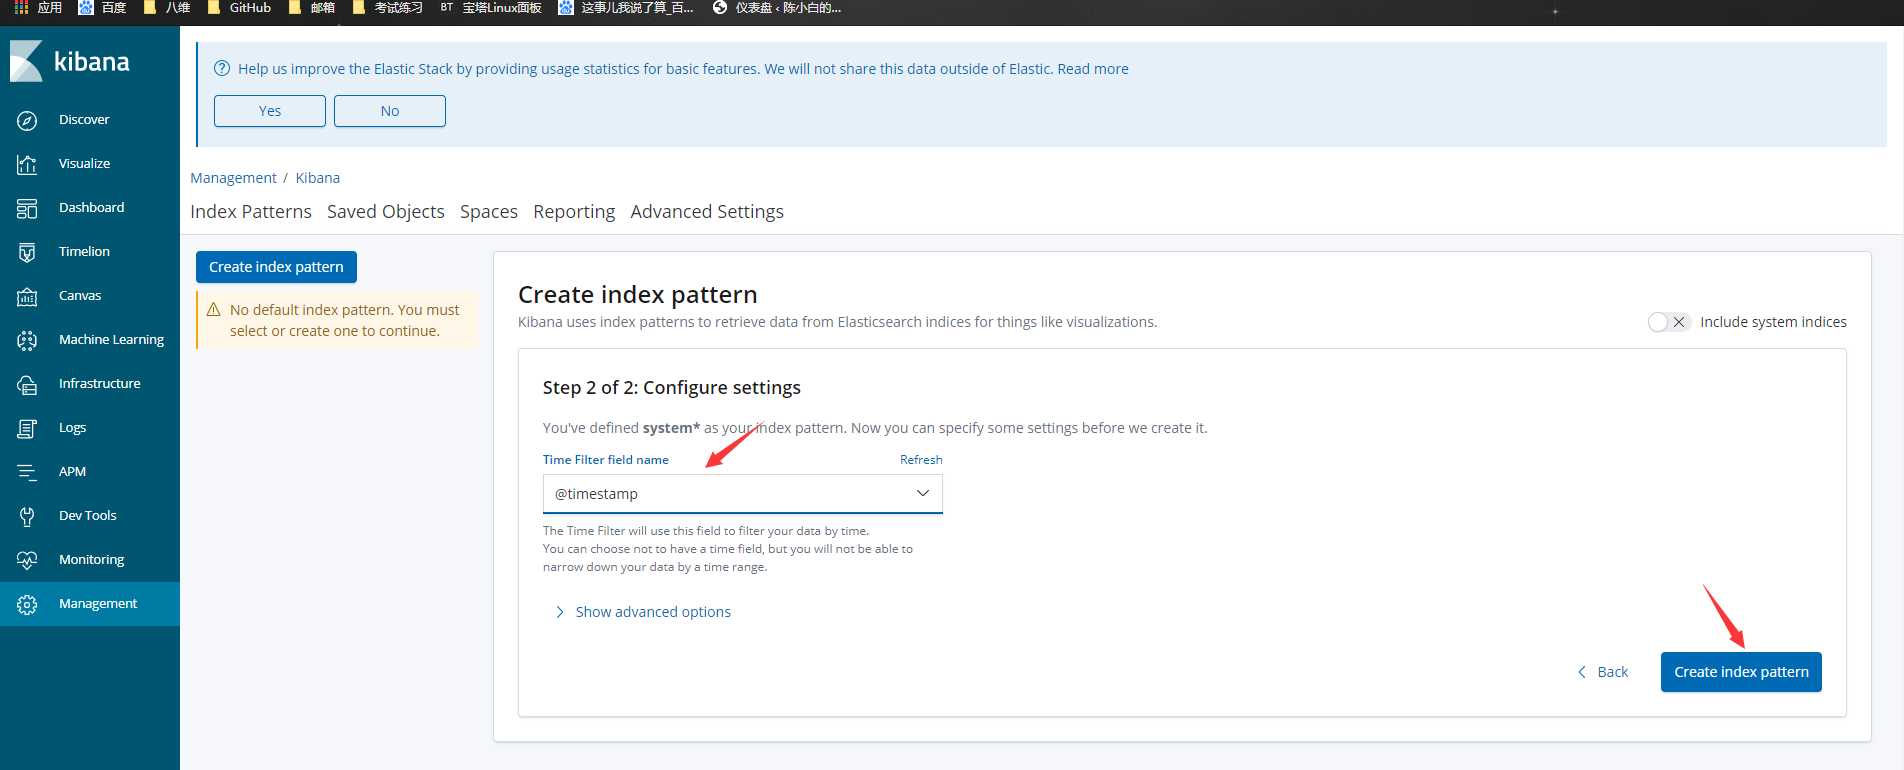
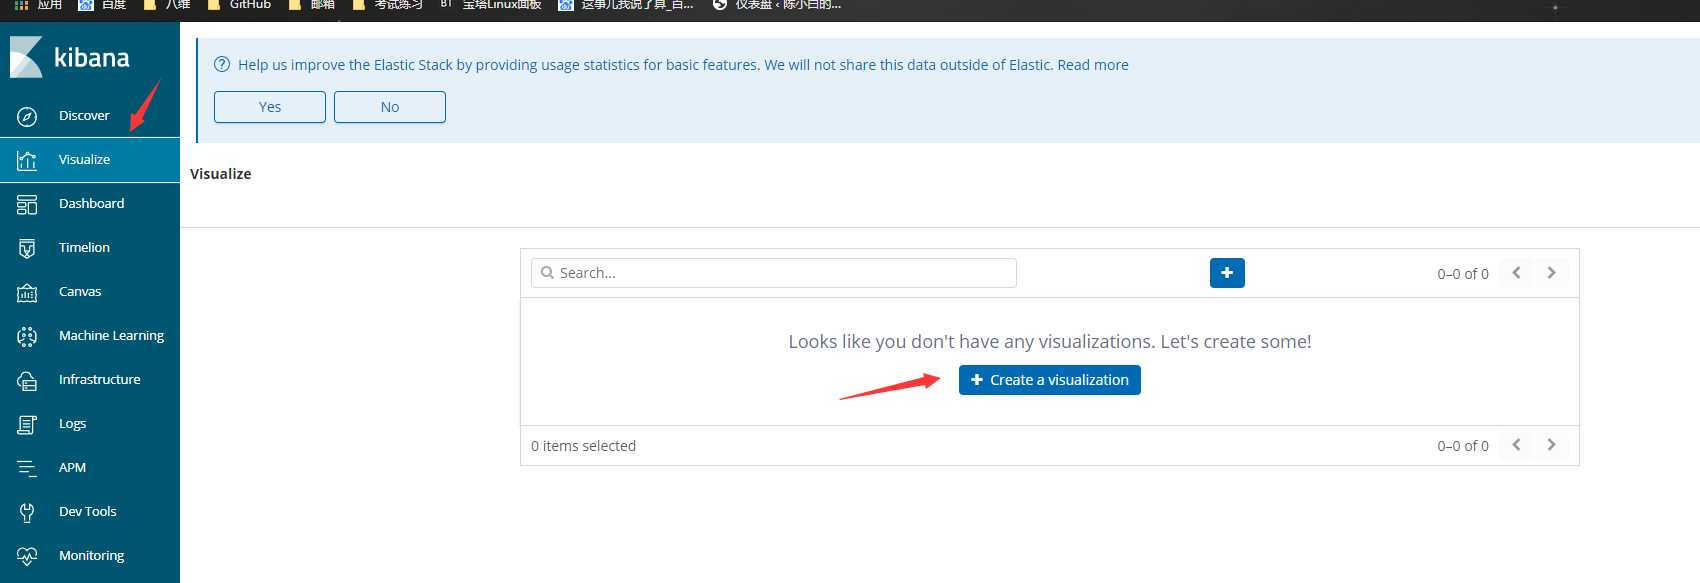
访问kibana的服务器 在浏览器中

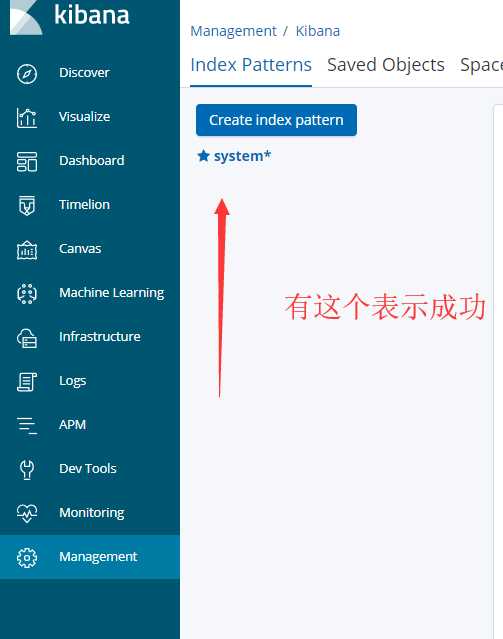


原文:https://www.cnblogs.com/kriskris/p/12072137.html