为您的平台下载最新版本的普罗米修斯,然后将其解压缩:
tar xvfz prometheus-*.tar.gz
cd prometheus-*
根目录下的prometheus.yml文件(默认配置):
global:
  scrape_interval:     15s
  evaluation_interval: 15s

rule_files:
  # - "first.rules"
  # - "second.rules"

scrape_configs:
  - job_name: prometheus
    static_configs:
      - targets: [‘localhost:9090‘]
根目录下执行以下命令:
./prometheus --config.file=prometheus.yml
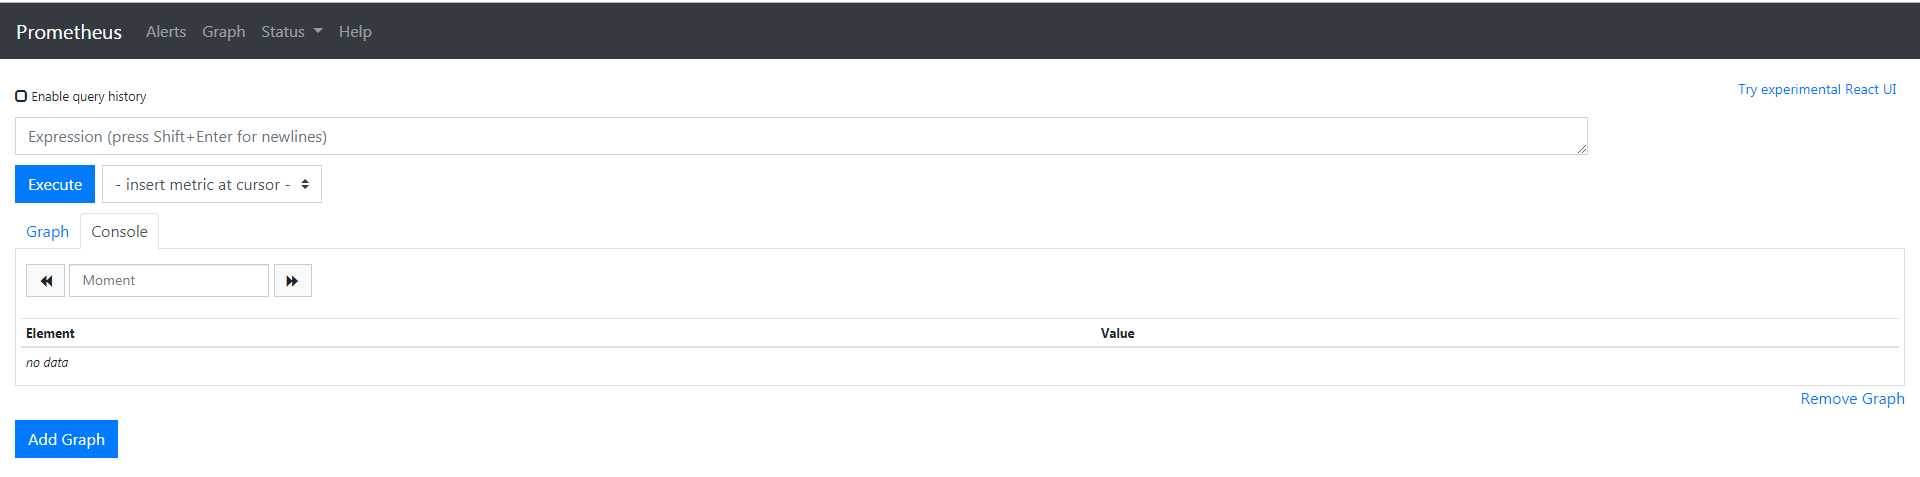
让我们看看prometheus收集到的一些关于自己的数据。要使用普罗米修斯的内置表达式浏览器,
请导航到 http://localhost:9090/graph 并在“graph”选项卡中选择“Console”视图。
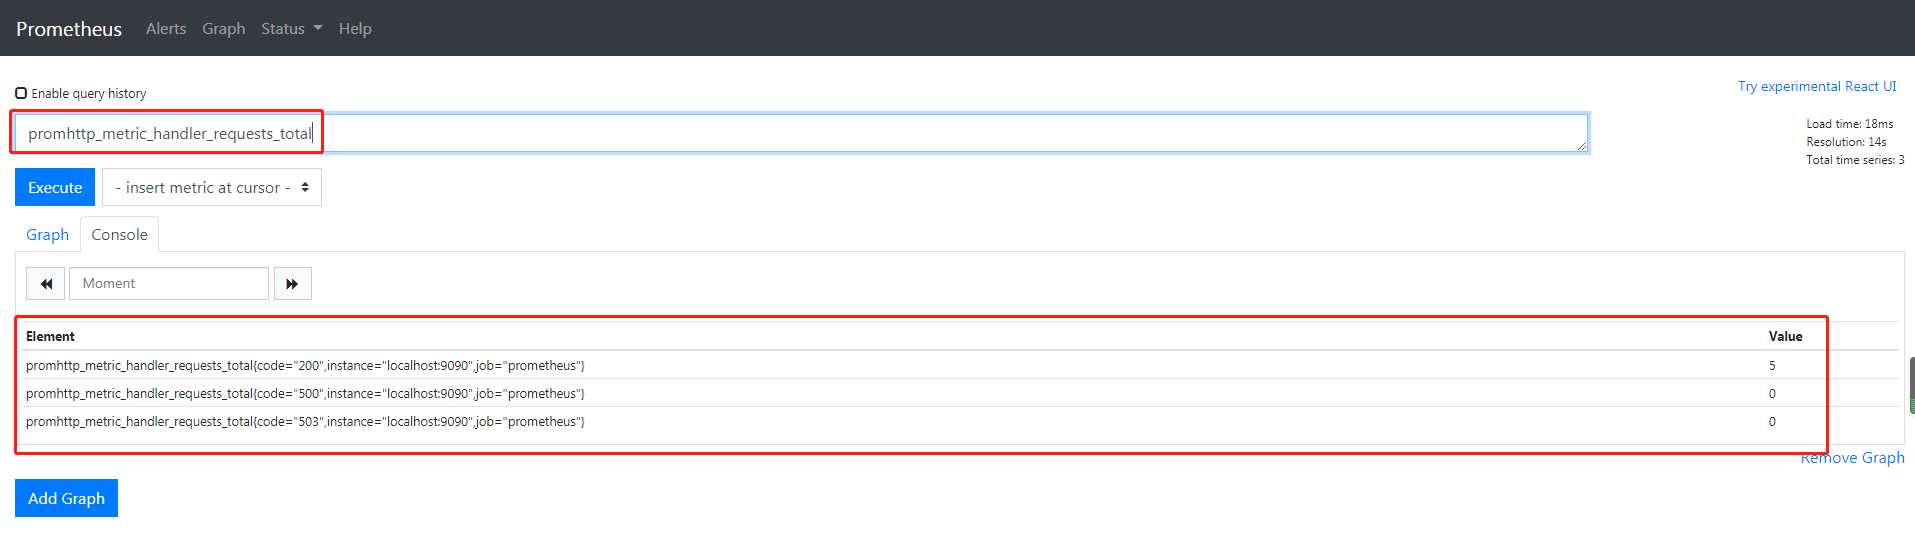
您可以从 http://localhost:9090/metrics 收集,prometheus导出的关于其自身的一个度量称为 promhttp_metric_handler_requests_total (prometheus服务器已服务的/metrics请求总数)。
继续并将其输入到表达式控制台中:
promhttp_metric_handler_requests_total
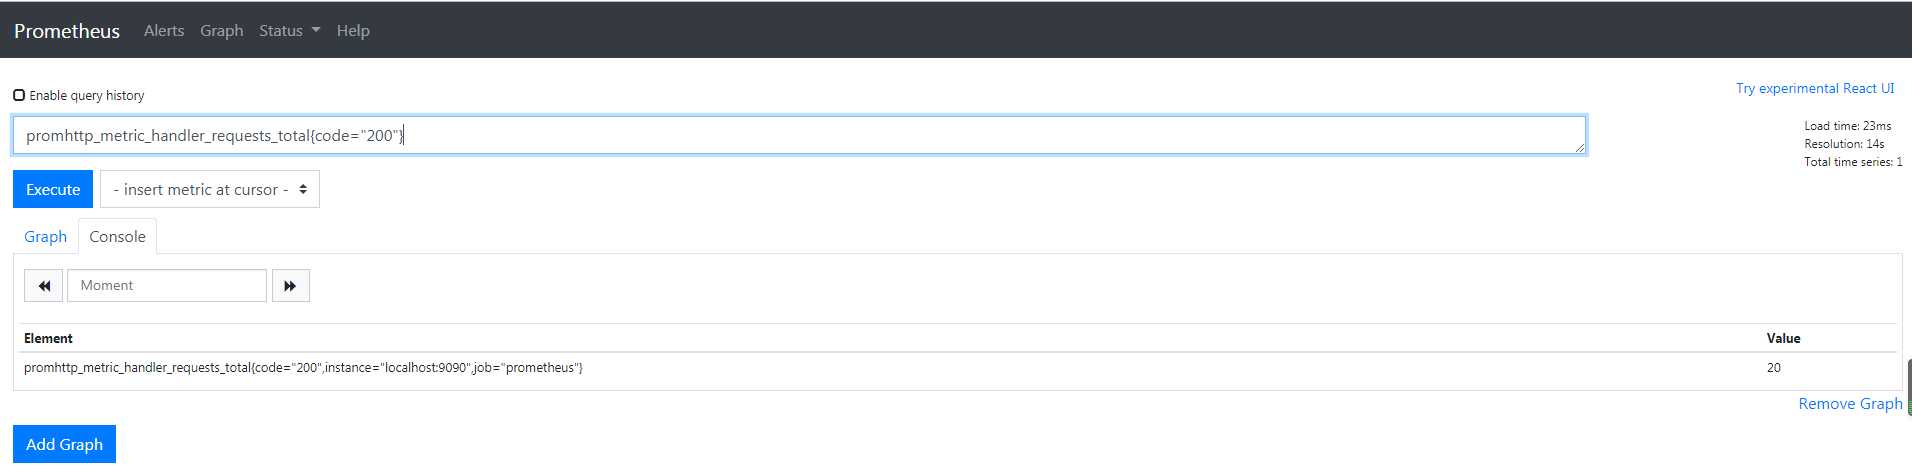
如果我们只对导致HTTP代码200的请求感兴趣,则可以使用此查询检索该信息:
promhttp_metric_handler_requests_total{code="200"}
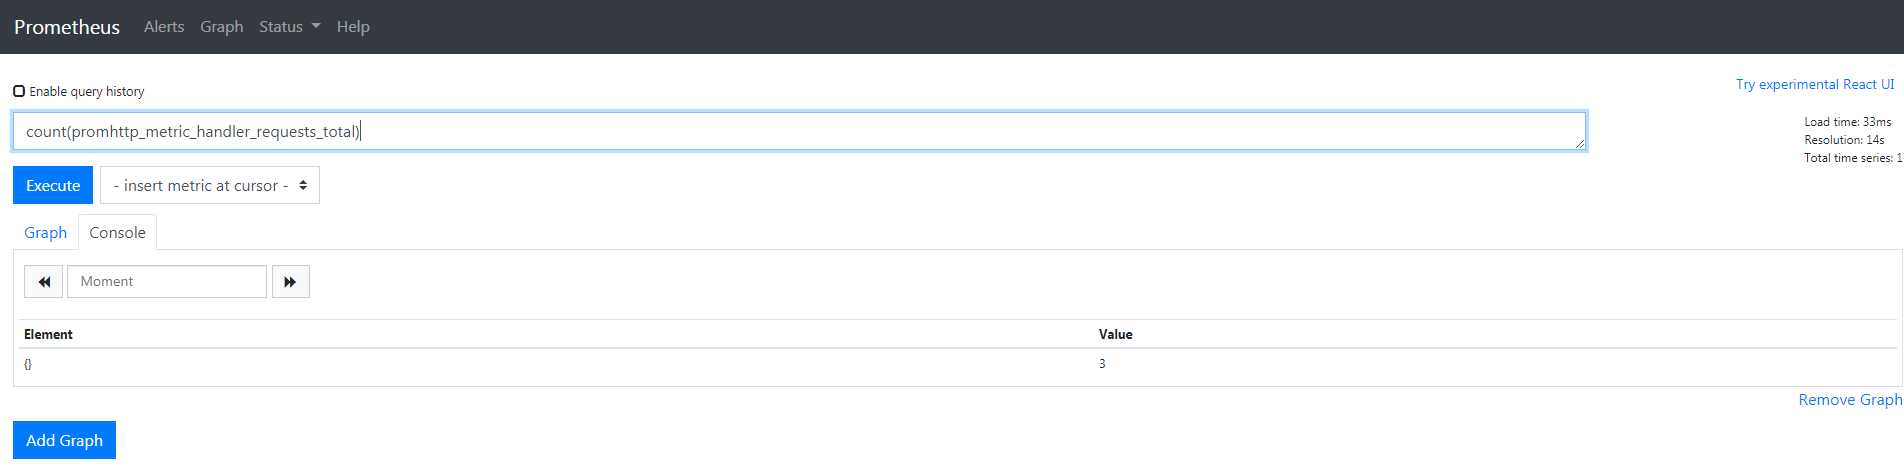
要计算返回的时间序列数,可以编写:
count(promhttp_metric_handler_requests_total)
有关表达式语言的更多信息,请参见: expression language documentation
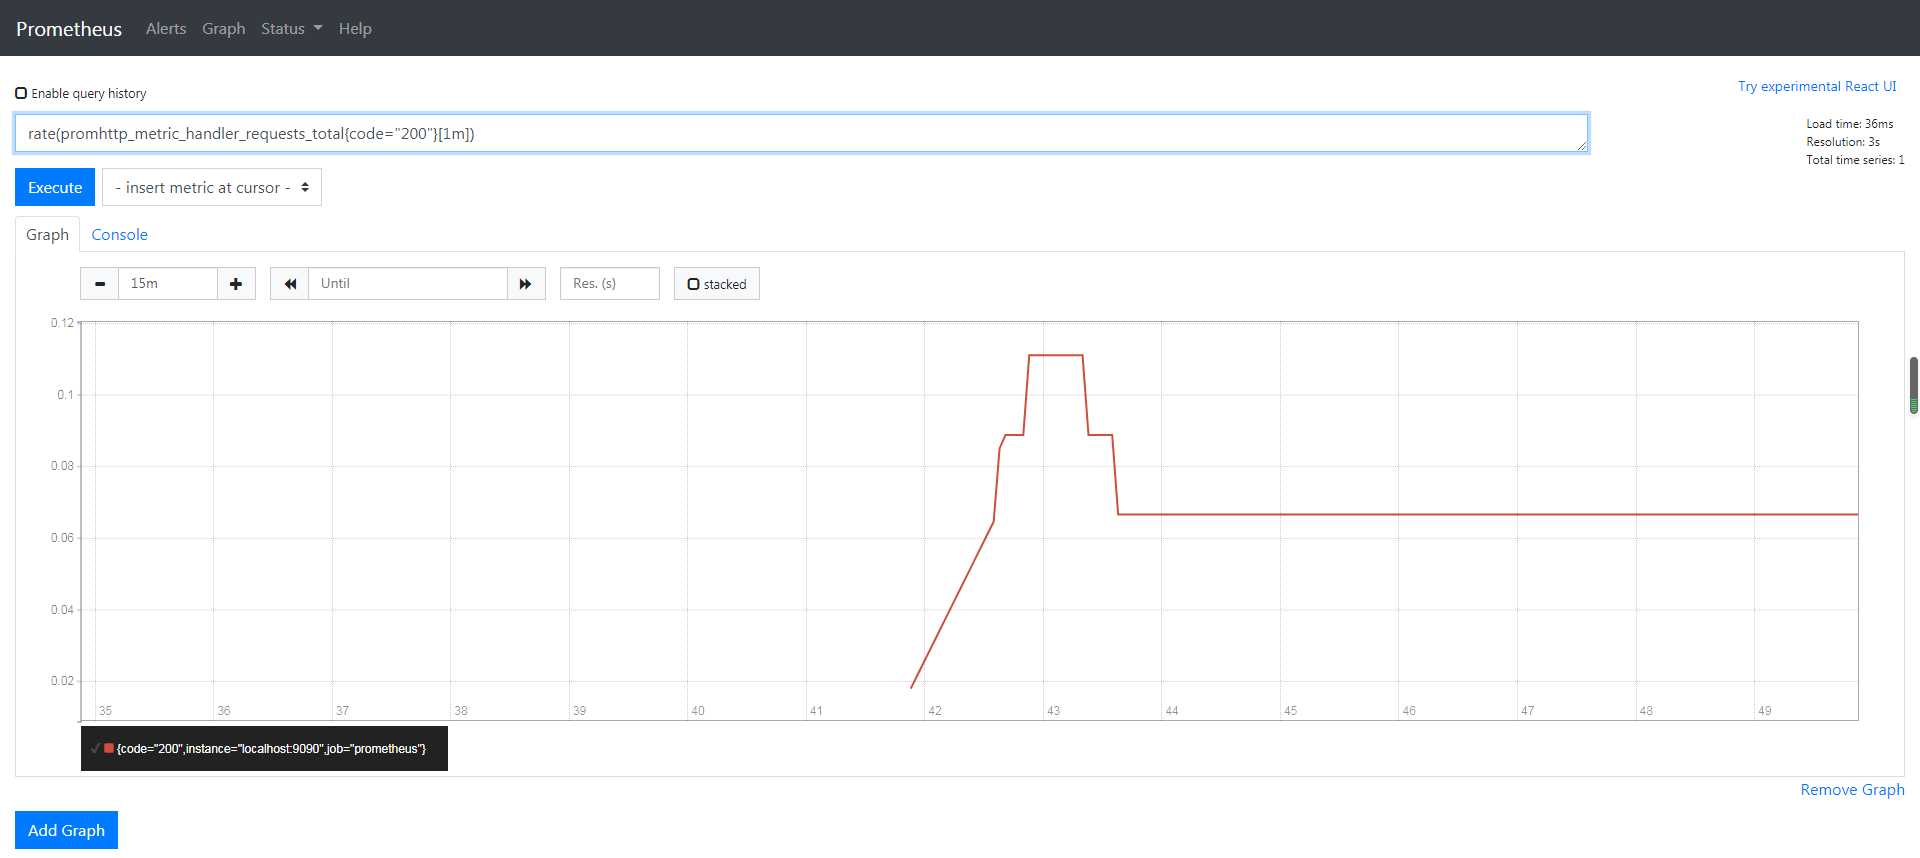
要绘制表达式,请导航到http://localhost:9090/graph并使用“graph”选项卡。
例如,输入以下表达式以图形化每秒在prometheus中发生的返回状态代码200的HTTP请求速率:
rate(promhttp_metric_handler_requests_total{code="200"}[1m])
原文:https://www.cnblogs.com/caoweixiong/p/12111035.html