** Cross-Correlation of Phase-Lagged Sine Wave
This example shows how to use the cross-correlation sequence to estimate the phase lag between two sine waves. The theoretical cross-correlation sequence of two sine waves at the same frequency also oscillates at that frequency. Because the sample cross-correlation sequence uses fewer and fewer samples at larger lags, the sample cross-correlation sequence also oscillates at the same frequency, but the amplitude decays as the lag increases.
Create two sine waves with frequencies of 2π/10 rad/sample.
The starting phase of one sine wave is 0, while the starting phase of the other sine wave is −π radians.
Add N(0,0.25^2) white noise to the sine wave with the phase lag of π radians.
Set the random number generator to the default settings for reproducible results.
t = 0:99;
x = cos(2*pi*1/10*t);
y = cos(2*pi*1/10*t-pi)+0.25*randn(size(t));
Obtain the sample cross-correlation sequence for two periods of the sine wave (10 samples).
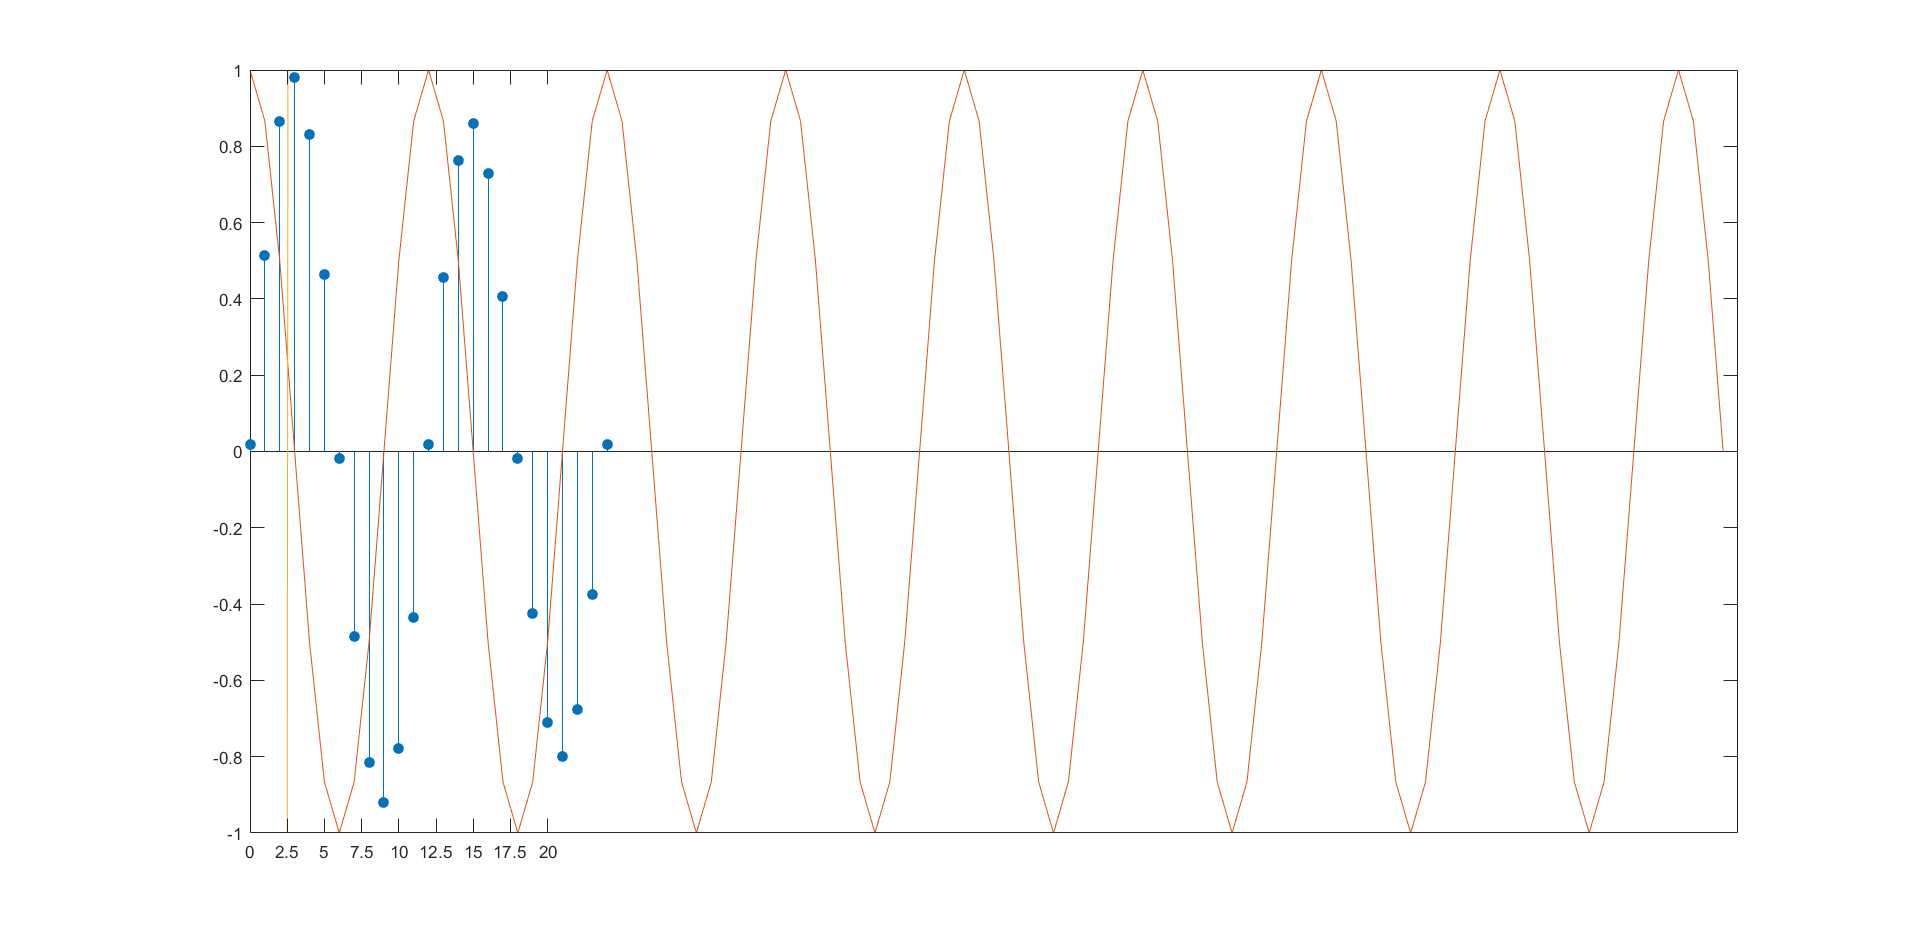
Plot the cross-correlation sequence and mark the known lag between the two sine waves (5 samples).
[xc,lags] = xcorr(y,x,20,‘coeff‘);

stem(lags(21:end),xc(21:end),‘filled‘)

hold on
plot([5 5],[-1 1])

ax = gca;
ax.XTick = 0:5:20;
% phase lag of sine and cosine function
% https://www.mathworks.com/help/signal/ug/cross-correlation-of-phase-lagged-sine-wave.html
rng default

t = 0:99;
x = cos(2*pi*1/12*t);  % 12 samples in one periods
y = sin(2*pi*1/12*t);
[xc,lags] = xcorr(y,x,24,‘coeff‘);

stem(lags(25:end),xc(25:end),‘filled‘)

hold on
plot (t,x)
%plot (t,y)
plot([2.5 2.55],[-1 1])

ax = gca;
ax.XTick = 0:2.5:20;
https://www.mathworks.com/help/signal/ug/cross-correlation-of-phase-lagged-sine-wave.html
Cross-Correlation of Phase-Lagged Sine Wave
原文:https://www.cnblogs.com/code-saturne/p/12180978.html