首页 > 其他 > 详细

批量生成饼状图

时间:2020-01-16 09:42:22      阅读:100      评论:0      收藏:0      [点我收藏+]

本人在图表设计中用一采用的是Java语言写的项目,此项目框架包含Spring、SpringMVC,前端用的是AdminLTE3的框架,另外还有一些简单的技术jquery、ajax、jdbc等。

技术分享图片

1、导入js文件

<!-- ChartJS -->
<script src="plugins/chart.js/Chart.min.js"></script>

  <!-- jQuery -->
  <script src="plugins/jquery/jquery.min.js"></script>

2、HTML页面编写

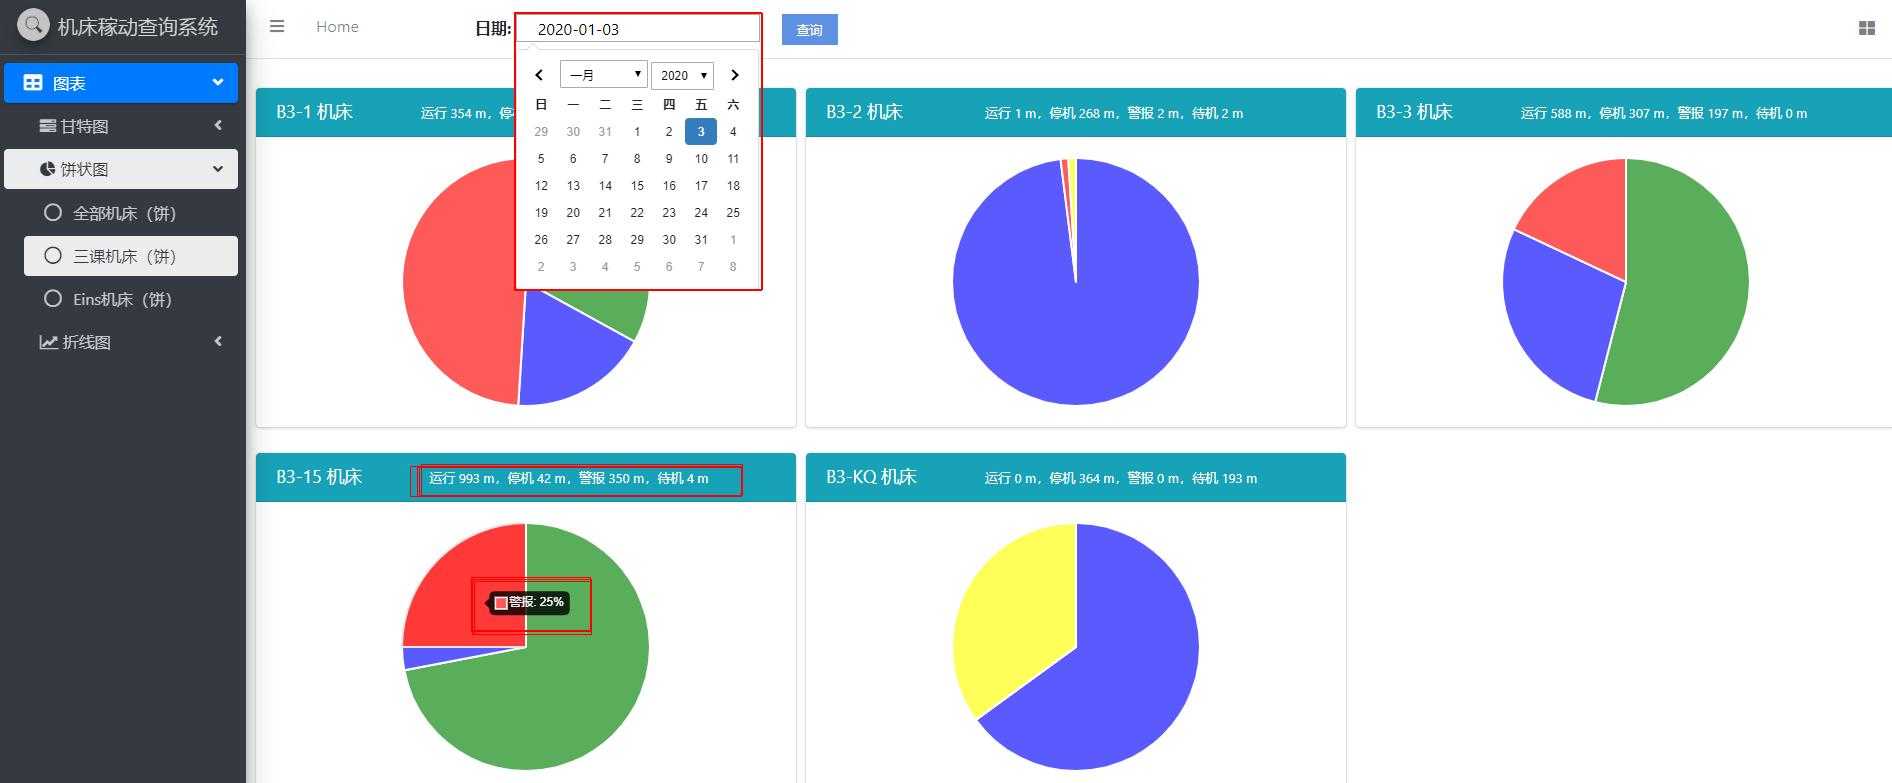
  下面代码中<div class="card card-info">其中的class引用的是AdminLTE3中的卡片样式,如需使用请百度查询如何使用。

  <div class="card-header" id="B3-1hd">
    <h3 class="card-title">B3-1 机床 </h3>
  </div>

  以上三行代码目的是为了动态显示机床的状态时间信息

  <canvas id="B3-1" style="min-height: 250px; height: 250px; max-height: 250px;"></canvas>为饼状图创建标签

技术分享图片
<table style="width: 1500px; margin-left: 5px;" align="center">
    <tr>
        <td style="padding: 5px 5px;">
        <div class="card card-info">
            <div class="card-header" id="B3-1hd">
                <h3 class="card-title">B3-1 机床 </h3>
            </div>
            <div class="card-body">
                <div class="chart" id="B3-1div">
                <canvas id="B3-1"style="min-height: 250px; height: 250px; max-height: 250px;"></canvas>
                </div>
                </div>
        </div>
        </td>
        <td style="padding: 5px 5px;">
        <div class="card card-info">
        <div class="card-header" id="B3-2hd">                                            
                 <h3 class="card-title">B3-2 机床</h3>                                        
           </div>
       <div class="card-body">
           <div class="chart" id="B3-2div">
            <canvas id="B3-2"    style="min-height: 250px; height: 250px; max-height: 250px;"></canvas>
        </div>
        </div>
    </div>
    </td>
    <td style="padding: 5px 5px;">
        <div class="card card-info">
    <div class="card-header" id="B3-3hd">
        <h3 class="card-title">B3-3 机床</h3>                                                
        </div>
    <div class="card-body">
        <div class="chart" id="B3-3div">
        <canvas id="B3-3"style="min-height: 250px; height: 250px; max-height: 250px;"></canvas>
            </div>
    </div>                                            
        </div>
    </td>
</tr>
<tr>
......后面饼状图同上                                                                               
View Code

3、日期插件

  日期选择使用的是AdminLTE3自带的日期组件

  使用方法:  

    导入cs:<link rel="stylesheet" href="plugins/daterangepicker/daterangepicker.css">

    导入js:<script src="plugins/daterangepicker/daterangepicker.js"></script>

    HTML:<input type="text" name="txtBeginDate" id="txtBeginDate" >

4、js编写

  ①日期组件

技术分享图片
$(function() {
//单个时间插件
    $("input[name=‘txtBeginDate‘]").daterangepicker(
    {
        singleDatePicker : true,//设置为单个的datepicker,而不是有区间的datepicker 默认false
        showDropdowns : true,//当设置值为true的时候,允许年份和月份通过下拉框的形式选择 默认false
        autoUpdateInput : false,//1.当设置为false的时候,不给与默认值(当前时间)2.选择时间时,失去鼠标焦点,不会给与默认值 默认true
        timePicker24Hour : true,//设置小时为24小时制 默认false
        timePicker : false,//可选中时分 默认false
        locale : {
        format : "YYYY-MM-DD",
        separator : " - ",
        daysOfWeek : [ "日", "一", "二", "三", "四", "五", "六" ],
        monthNames : [ "一月", "二月", "三月", "四月", "五月", "六月","七月", "八月", "九月", "十月", "十一月", "十二月" ]
                        }
    }).on(‘cancel.daterangepicker‘, function(ev, picker) {
        $("#submitDate").val("");
        }).on(‘apply.daterangepicker‘, function(ev, picker) {
$("#submitDate").val(picker.startDate.format(‘YYYY-MM-DD‘));
$("#txtBeginDate").val(picker.startDate.format(‘YYYY-MM-DD‘));
            });
    });
View Code

  ②查询按钮事件

技术分享图片
$(function() {
            $("#btfind")
                    .click(
                            function() {
                                var strdate = $("#txtBeginDate").val();
                                $
                                        .ajax({
                                            url : "${pageContext.request.contextPath}/pieData",
                                            type : "post",
                                            data : {
                                                tempDate : strdate,
                                                mType : "allType"
                                            },
                                            success : function(data) {
                                                if(data==null ||data==""){
                                                    alert("未查询到对应数据!");
                                                }
                                                var List = null;
                                                for (var key = 0; key < data.length; key++) {
                                                    var flag = 1;
                                                    List = data[key];
                                                    var len = List.length;
                                                    for (var i = 0; i < len; i++) {
                                                        if (flag == 1) {
                                                            $("#" + List[0]).remove();
                                                            $("#"+List[0] +"ft").remove();
                                                            $("#"+List[0] +"hd").append("<font size=‘2‘ id="+List[0]+"ft>运行 "+List[1]+" m,停机 "+List[2]+" m,待机"+List[3]+" m,警报 "+List[4]+" m</font>");
                                                            $(
                                                                    "#"
                                                                            + List[0]
                                                                            + "div")
                                                                    .append(
                                                                            ‘<canvas id="‘+List[0]+‘" style="min-height: 250px; height: 250px; max-height: 250px;"></canvas>‘);
                                                        }
                                                        flag = 0;
                                                        var ctx = document.getElementById(List[0]);
                                                        var myChart = new Chart(
                                                                ctx,
                                                                {
                                                                    type : ‘pie‘,
                                                                    data : {
                                                                        labels : [
                                                                                ‘运行‘,
                                                                                ‘停机‘,
                                                                                ‘待机‘,
                                                                                ‘警报‘ ],
                                                                        datasets : [ {
                                                                            data : [
                                                                                    List[5],
                                                                                    List[6],
                                                                                    List[7],
                                                                                    List[8] ],
                                                                            backgroundColor : [
                                                                                    ‘#5AAD5A‘,
                                                                                    ‘#5A5AFF‘,
                                                                                    ‘#FFFF5A‘,
                                                                                    ‘#FF5A5A‘ ],
                                                                        } ],
                                                                    },
                                                                    options : {
                                                                        maintainAspectRatio : false,
                                                                        responsive : true,
                                                                        legend : {
                                                                            display : false
                                                                        },
                                                                        
                                                                    }
                                                                });

                                                    }
                                                }

                                            }
                                        });
                            });
        });
View Code

5、后台controller代码

技术分享图片
        @Autowired
    private GanttService gs;
    /**
     * 
     * @Title: findData @Description: TODO(显示指定日期下指定类型内指定状态机床运行情况) @param itdate
      *         用户选择的日期 @param stateColor 用户选择的运行状态 @param mtype 用户选择的机床种类 @return
     *         ArrayList<ArrayList<String>> 指定日期下指定类型中机床指定状态的运行状态 @throws
     */
    @RequestMapping(value = "/ganttData", method = RequestMethod.POST)
    @ResponseBody
    public ArrayList<ArrayList<String>> findData(String itdate, String stateColor, String mtype) {
        return gs.searchData(mtype, itdate, stateColor);
    }
View Code

6、提示

  请注意后端返回到前端的数据格式,必须要一致,否则无法展示数据的信息。


批量生成饼状图

原文:https://www.cnblogs.com/blogcy/p/12199572.html

(0)
(0)
   
举报
评论 一句话评论(0
关于我们 - 联系我们 - 留言反馈 - 联系我们:wmxa8@hotmail.com
© 2014 bubuko.com 版权所有
打开技术之扣,分享程序人生!