
Apache JMeter是一个纯Java开发的用于负载测试或者性能测试的开源软件。这篇文章介绍一下建立基于JMeter的一主多从的容器化压测环境。
关于基于Alpine基础的JMeter镜像相关的介绍和使用方式,可以参看如下内容:
在JMeter创建的容器化的分布式压测环境中通过JMX定义压测内容,通过卷交换数据,使用Master节点进行作业的分配,在Slave节点上运行具体的压测内容。一个非常简单的一主多从构成的容器化分布式压测环境可以参看下图。

本文使用一个Master节点,3个Slave节点形成的1主三从的分布式测试环境,为了简单演示使用的是同一台机器,具体构成如下所示
| 类型 | IP | 端口 | 说明 |
|---|---|---|---|
| Master节点 | 192.168.31.242 | - | 用于控制的Master节点 |
| Slave节点-1 | 192.168.31.242 | 31099 | 用于进行压测的Slave节点1 |
| Slave节点-2 | 192.168.31.242 | 31020 | 用于进行压测的Slave节点2 |
| Slave节点-3 | 192.168.31.242 | 31021 | 用于进行压测的Slave节点3 |
liumiaocn:~ liumiao$ docker pull liumiaocn/jmeter:5.1.1
5.1.1: Pulling from liumiaocn/jmeter
9d48c3bd43c5: Already exists
b2da696b9ce3: Pull complete
Digest: sha256:bd7bb96d90b5ac7c8f72f147fc0b063bf845aa5f8daee48a1c525a1479d27d91
Status: Downloaded newer image for liumiaocn/jmeter:5.1.1
liumiaocn:~ liumiao$ docker images |grep jmeter |grep 5.1.1 |grep liumiaocn
liumiaocn/jmeter                                5.1.1                           9e0fdc73a1d9        8 hours ago         190MB
liumiaocn:~ liumiao$
在本文的示例中,只需要分别在启动如下三个jmeter的Slave压测实例即可:
启动命令:docker run -d -p 31099:1099 liumiaocn/jmeter:5.1.1 jmeter -Dserver.rmi.ssl.disable=true -s -j /tmp/jmeter-slave.log
启动命令:docker run -d -p 31020:1099 liumiaocn/jmeter:5.1.1 jmeter -Dserver.rmi.ssl.disable=true -s -j /tmp/jmeter-slave.log
启动命令:docker run -d -p 31021:1099 liumiaocn/jmeter:5.1.1 jmeter -Dserver.rmi.ssl.disable=true -s -j /tmp/jmeter-slave.log
启动示例结果如下所示:
liumiaocn:~ liumiao$ docker run -d -p 31099:1099 liumiaocn/jmeter:5.1.1 jmeter -Dserver.rmi.ssl.disable=true -s -j /tmp/jmeter-slave.log
f033f1166b50dae6526f125a4ae09c920aba29c07026a524794faba5d94e233d
liumiaocn:~ liumiao$ docker run -d -p 31020:1099 liumiaocn/jmeter:5.1.1 jmeter -Dserver.rmi.ssl.disable=true -s -j /tmp/jmeter-slave.log
0f2c01b91646e374216d792352c1d63267ef246cfc8eec49d157c4ff0d77203e
liumiaocn:~ liumiao$ docker run -d -p 31021:1099 liumiaocn/jmeter:5.1.1 jmeter -Dserver.rmi.ssl.disable=true -s -j /tmp/jmeter-slave.log
c168ec47eeca665af7a418ea2d531a8c22fc96a07442cc3c66dd48f2448658c1
liumiaocn:~ liumiao$
启动之后可以使用下述docker ps命令确认Slave节点服务运行状态
liumiaocn:~ liumiao$ docker ps |grep jmeter
c168ec47eeca        liumiaocn/jmeter:5.1.1    "jmeter -Dserver.rmi…"   36 seconds ago      Up 36 seconds       0.0.0.0:31021->1099/tcp                            stoic_einstein
0f2c01b91646        liumiaocn/jmeter:5.1.1    "jmeter -Dserver.rmi…"   45 seconds ago      Up 45 seconds       0.0.0.0:31020->1099/tcp                            affectionate_nobel
f033f1166b50        liumiaocn/jmeter:5.1.1    "jmeter -Dserver.rmi…"   53 seconds ago      Up 53 seconds       0.0.0.0:31099->1099/tcp                            frosty_meitner
liumiaocn:~ liumiao$
以Slave节点-3为例,执行日志如下所示:
liumiaocn:~ liumiao$ docker logs stoic_einstein
Oct 09, 2019 1:17:25 AM java.util.prefs.FileSystemPreferences$1 run
INFO: Created user preferences directory.
Created remote object: UnicastServerRef2 [liveRef: [endpoint:[172.17.0.8:33505](local),objID:[7136948f:16dae179b4c:-7fff, 4353982455942980784]]]
liumiaocn:~ liumiao$
在本地机器的8088端口使用Docker启动一个Nginx应用(使用其他方式也可),示例如下所示:
liumiaocn:~ liumiao$ docker images |grep nginx |grep latest
nginx                                           latest                          e445ab08b2be        2 months ago        126MB
liumiaocn:~ liumiao$ docker run -p 8088:80 -d --name=nginx-test nginx:latest
a80fb1a4fc20627891a6bd7394fd79ae9aefb7dc8cf72c12967bc2673a815308
liumiaocn:~ liumiao$
使用curl命令或者直接使用浏览器确认nginx已正常运行
liumiaocn:~ liumiao$ curl http://localhost:8088/
<!DOCTYPE html>
<html>
<head>
<title>Welcome to nginx!</title>
<style>
    body {
        width: 35em;
        margin: 0 auto;
        font-family: Tahoma, Verdana, Arial, sans-serif;
    }
</style>
</head>
<body>
<h1>Welcome to nginx!</h1>
<p>If you see this page, the nginx web server is successfully installed and
working. Further configuration is required.</p>

<p>For online documentation and support please refer to
<a href="http://nginx.org/">nginx.org</a>.<br/>
Commercial support is available at
<a href="http://nginx.com/">nginx.com</a>.</p>

<p><em>Thank you for using nginx.</em></p>
</body>
</html>
liumiaocn:~ liumiao$
并行启动100个线程组,平均每个线程组对http://localhost:8088执行一次http的get方法,合计进行1000次压力测试的jmx文件详细信息如下所示:
liumiaocn:data liumiao$ cat httprequest.jmx
<?xml version="1.0" encoding="UTF-8"?>
<jmeterTestPlan version="1.2" properties="5.0" jmeter="5.1.1 r1855137">
  <hashTree>
    <TestPlan guiclass="TestPlanGui" testclass="TestPlan" testname="测试计划" enabled="true">
      <stringProp name="TestPlan.comments"></stringProp>
      <boolProp name="TestPlan.functional_mode">false</boolProp>
      <boolProp name="TestPlan.tearDown_on_shutdown">true</boolProp>
      <boolProp name="TestPlan.serialize_threadgroups">false</boolProp>
      <elementProp name="TestPlan.user_defined_variables" elementType="Arguments" guiclass="ArgumentsPanel" testclass="Arguments" testname="用户定义的变量" enabled="true">
        <collectionProp name="Arguments.arguments"/>
      </elementProp>
      <stringProp name="TestPlan.user_define_classpath"></stringProp>
    </TestPlan>
    <hashTree>
      <ThreadGroup guiclass="ThreadGroupGui" testclass="ThreadGroup" testname="线程组" enabled="true">
        <stringProp name="ThreadGroup.on_sample_error">continue</stringProp>
        <elementProp name="ThreadGroup.main_controller" elementType="LoopController" guiclass="LoopControlPanel" testclass="LoopController" testname="循环控制器" enabled="true">
          <boolProp name="LoopController.continue_forever">false</boolProp>
          <stringProp name="LoopController.loops">10</stringProp>
        </elementProp>
        <stringProp name="ThreadGroup.num_threads">100</stringProp>
        <stringProp name="ThreadGroup.ramp_time">1</stringProp>
        <boolProp name="ThreadGroup.scheduler">false</boolProp>
        <stringProp name="ThreadGroup.duration"></stringProp>
        <stringProp name="ThreadGroup.delay"></stringProp>
      </ThreadGroup>
      <hashTree>
        <HTTPSamplerProxy guiclass="HttpTestSampleGui" testclass="HTTPSamplerProxy" testname="HTTP请求" enabled="true">
          <elementProp name="HTTPsampler.Arguments" elementType="Arguments" guiclass="HTTPArgumentsPanel" testclass="Arguments" testname="用户定义的变量" enabled="true">
            <collectionProp name="Arguments.arguments">
              <elementProp name="" elementType="HTTPArgument">
                <boolProp name="HTTPArgument.always_encode">false</boolProp>
                <stringProp name="Argument.value"></stringProp>
                <stringProp name="Argumen127.0.0.1tadata">=</stringProp>
                <boolProp name="HTTPArgument.use_equals">true</boolProp>
              </elementProp>
            </collectionProp>
          </elementProp>
          <stringProp name="HTTPSampler.domain">192.168.31.242</stringProp>
          <stringProp name="HTTPSampler.port">8088</stringProp>
          <stringProp name="HTTPSampler.protocol">http</stringProp>
          <stringProp name="HTTPSampler.contentEncoding"></stringProp>
          <stringProp name="HTTPSampler.path">/</stringProp>
          <stringProp name="HTTPSampler.method">GET</stringProp>
          <boolProp name="HTTPSampler.follow_redirects">true</boolProp>
          <boolProp name="HTTPSampler.auto_redirects">false</boolProp>
          <boolProp name="HTTPSampler.use_keepalive">true</boolProp>
          <boolProp name="HTTPSampler.DO_MULTIPART_POST">false</boolProp>
          <stringProp name="HTTPSampler.embedded_url_re"></stringProp>
          <stringProp name="HTTPSampler.connect_timeout"></stringProp>
          <stringProp name="HTTPSampler.response_timeout"></stringProp>
        </HTTPSamplerProxy>
        <hashTree>
          <ResultCollector guiclass="StatVisualizer" testclass="ResultCollector" testname="聚合报告" enabled="true">
            <boolProp name="ResultCollector.error_logging">false</boolProp>
            <objProp>
              <name>saveConfig</name>
              <value class="SampleSaveConfiguration">
                <time>true</time>
                <latency>true</latency>
                <timestamp>true</timestamp>
                <success>true</success>
                <label>true</label>
                <code>true</code>
                <message>true</message>
                <threadName>true</threadName>
                <dataType>true</dataType>
                <encoding>false</encoding>
                <assertions>true</assertions>
                <subresults>true</subresults>
                <responseData>false</responseData>
                <samplerData>false</samplerData>
                <xml>false</xml>
                <fieldNames>true</fieldNames>
                <responseHeaders>false</responseHeaders>
                <requestHeaders>false</requestHeaders>
                <responseDataOnError>false</responseDataOnError>
                <saveAssertionResultsFailureMessage>true</saveAssertionResultsFailureMessage>
                <assertionsResultsToSave>0</assertionsResultsToSave>
                <bytes>true</bytes>
                <sentBytes>true</sentBytes>
                <url>true</url>
                <threadCounts>true</threadCounts>
                <idleTime>true</idleTime>
                <connectTime>true</connectTime>
              </value>
            </objProp>
            <stringProp name="filename">/tmp/jmeter-result.jtl</stringProp>
          </ResultCollector>
          <hashTree/>
        </hashTree>
      </hashTree>
    </hashTree>
  </hashTree>
</jmeterTestPlan>
liumiaocn:data liumiao$
Master节点可以只在调用的时候启动(事前需要准备jmx文件),启动示例命令如下所示
启动命令示例:
docker run -it -v $(pwd)/data:/data liumiaocn/jmeter:5.1.1 jmeter -n -t /data/httprequest.jmx -R 192.168.31.242:31099 -Dserver.rmi.ssl.disable=true -l /tmp/jmeter-result.jtl -j /data/jmeter-test.log -e -o /data/test-result
通过上述命令的执行,Master节点通知Slave-1节点执行了1000次压力测试的内容。执行日志如下所示:
liumiaocn:tmp liumiao$ ls data
httprequest.jmx
liumiaocn:tmp liumiao$ docker run -it -v $(pwd)/data:/data  liumiaocn/jmeter:5.1.1 jmeter -n -t /data/httprequest.jmx -R 192.168.31.242:31099 -Dserver.rmi.ssl.disable=true -l /tmp/jmeter-result.jtl -j /data/jmeter-test.log -e -o /data/test-result
Oct 09, 2019 1:34:04 AM java.util.prefs.FileSystemPreferences$1 run
INFO: Created user preferences directory.
Creating summariser <summary>
Created the tree successfully using /data/httprequest.jmx
Configuring remote engine: 192.168.31.242:31099
Starting remote engines
Starting the test @ Wed Oct 09 01:34:05 GMT 2019 (1570584845634)
Remote engines have been started
Waiting for possible Shutdown/StopTestNow/HeapDump/ThreadDump message on port 4445
summary =   1000 in 00:00:03 =  369.4/s Avg:    75 Min:     2 Max:  1316 Err:     0 (0.00%)
Tidying up remote @ Wed Oct 09 01:34:11 GMT 2019 (1570584851213)
... end of run
liumiaocn:tmp liumiao$
从Slave节点的日志中也可以看到执行的痕迹
liumiaocn:tmp liumiao$ docker ps |grep jmeter
c168ec47eeca        liumiaocn/jmeter:5.1.1    "jmeter -Dserver.rmi…"   19 minutes ago      Up 19 minutes       0.0.0.0:31021->1099/tcp                            stoic_einstein
0f2c01b91646        liumiaocn/jmeter:5.1.1    "jmeter -Dserver.rmi…"   19 minutes ago      Up 19 minutes       0.0.0.0:31020->1099/tcp                            affectionate_nobel
f033f1166b50        liumiaocn/jmeter:5.1.1    "jmeter -Dserver.rmi…"   19 minutes ago      Up 19 minutes       0.0.0.0:31099->1099/tcp                            frosty_meitner
liumiaocn:tmp liumiao$ docker logs frosty_meitner
Oct 09, 2019 1:17:09 AM java.util.prefs.FileSystemPreferences$1 run
INFO: Created user preferences directory.
Created remote object: UnicastServerRef2 [liveRef: [endpoint:[172.17.0.6:33609](local),objID:[-36fa334e:16dae175b18:-7fff, -3829622535213060670]]]
Starting the test on host 192.168.31.242:31099 @ Wed Oct 09 01:34:07 GMT 2019 (1570584847543)
Finished the test on host 192.168.31.242:31099 @ Wed Oct 09 01:34:11 GMT 2019 (1570584851214)
liumiaocn:tmp liumiao$
当然进入到Slave节点内部,更能清楚的看到结果,根据实际的需要也可将次内容挂出进行持久保存,本文只是进行示例,不再过多赘述。
/usr/local/apache-jmeter-5.1.1/bin # cd /tmp
/tmp # ls
hsperfdata_root   jmeter-slave.log
/tmp # cat jmeter-slave.log
2019-10-09 01:17:09,167 INFO o.a.j.u.JMeterUtils: Setting Locale to en_EN
...省略
2019-10-09 01:34:11,144 INFO o.a.j.t.JMeterThread: Thread is done: 192.168.31.242:31099-线程组 1-29
2019-10-09 01:34:11,144 INFO o.a.j.t.JMeterThread: Thread finished: 192.168.31.242:31099-线程组 1-29
2019-10-09 01:34:11,149 INFO o.a.j.t.JMeterThread: Thread is done: 192.168.31.242:31099-线程组 1-1
2019-10-09 01:34:11,149 INFO o.a.j.t.JMeterThread: Thread finished: 192.168.31.242:31099-线程组 1-1
2019-10-09 01:34:11,150 INFO o.a.j.e.StandardJMeterEngine: Notifying test listeners of end of test
2019-10-09 01:34:11,150 INFO o.a.j.s.DataStrippingSampleSender: Test Ended on 192.168.31.242:31099
2019-10-09 01:34:11,150 INFO o.a.j.s.BatchSampleSender: Test Ended on 192.168.31.242:31099
2019-10-09 01:34:11,162 INFO o.a.j.s.DataStrippingSampleSender: Test Ended on 192.168.31.242:31099
2019-10-09 01:34:11,162 INFO o.a.j.s.BatchSampleSender: Test Ended on 192.168.31.242:31099
2019-10-09 01:34:11,214 INFO o.a.j.e.StandardJMeterEngine: Test has ended on host 192.168.31.242:31099
/tmp #
上诉1000次压力测试报告也同时得到了生成,压测结果的概要信息如下图所示
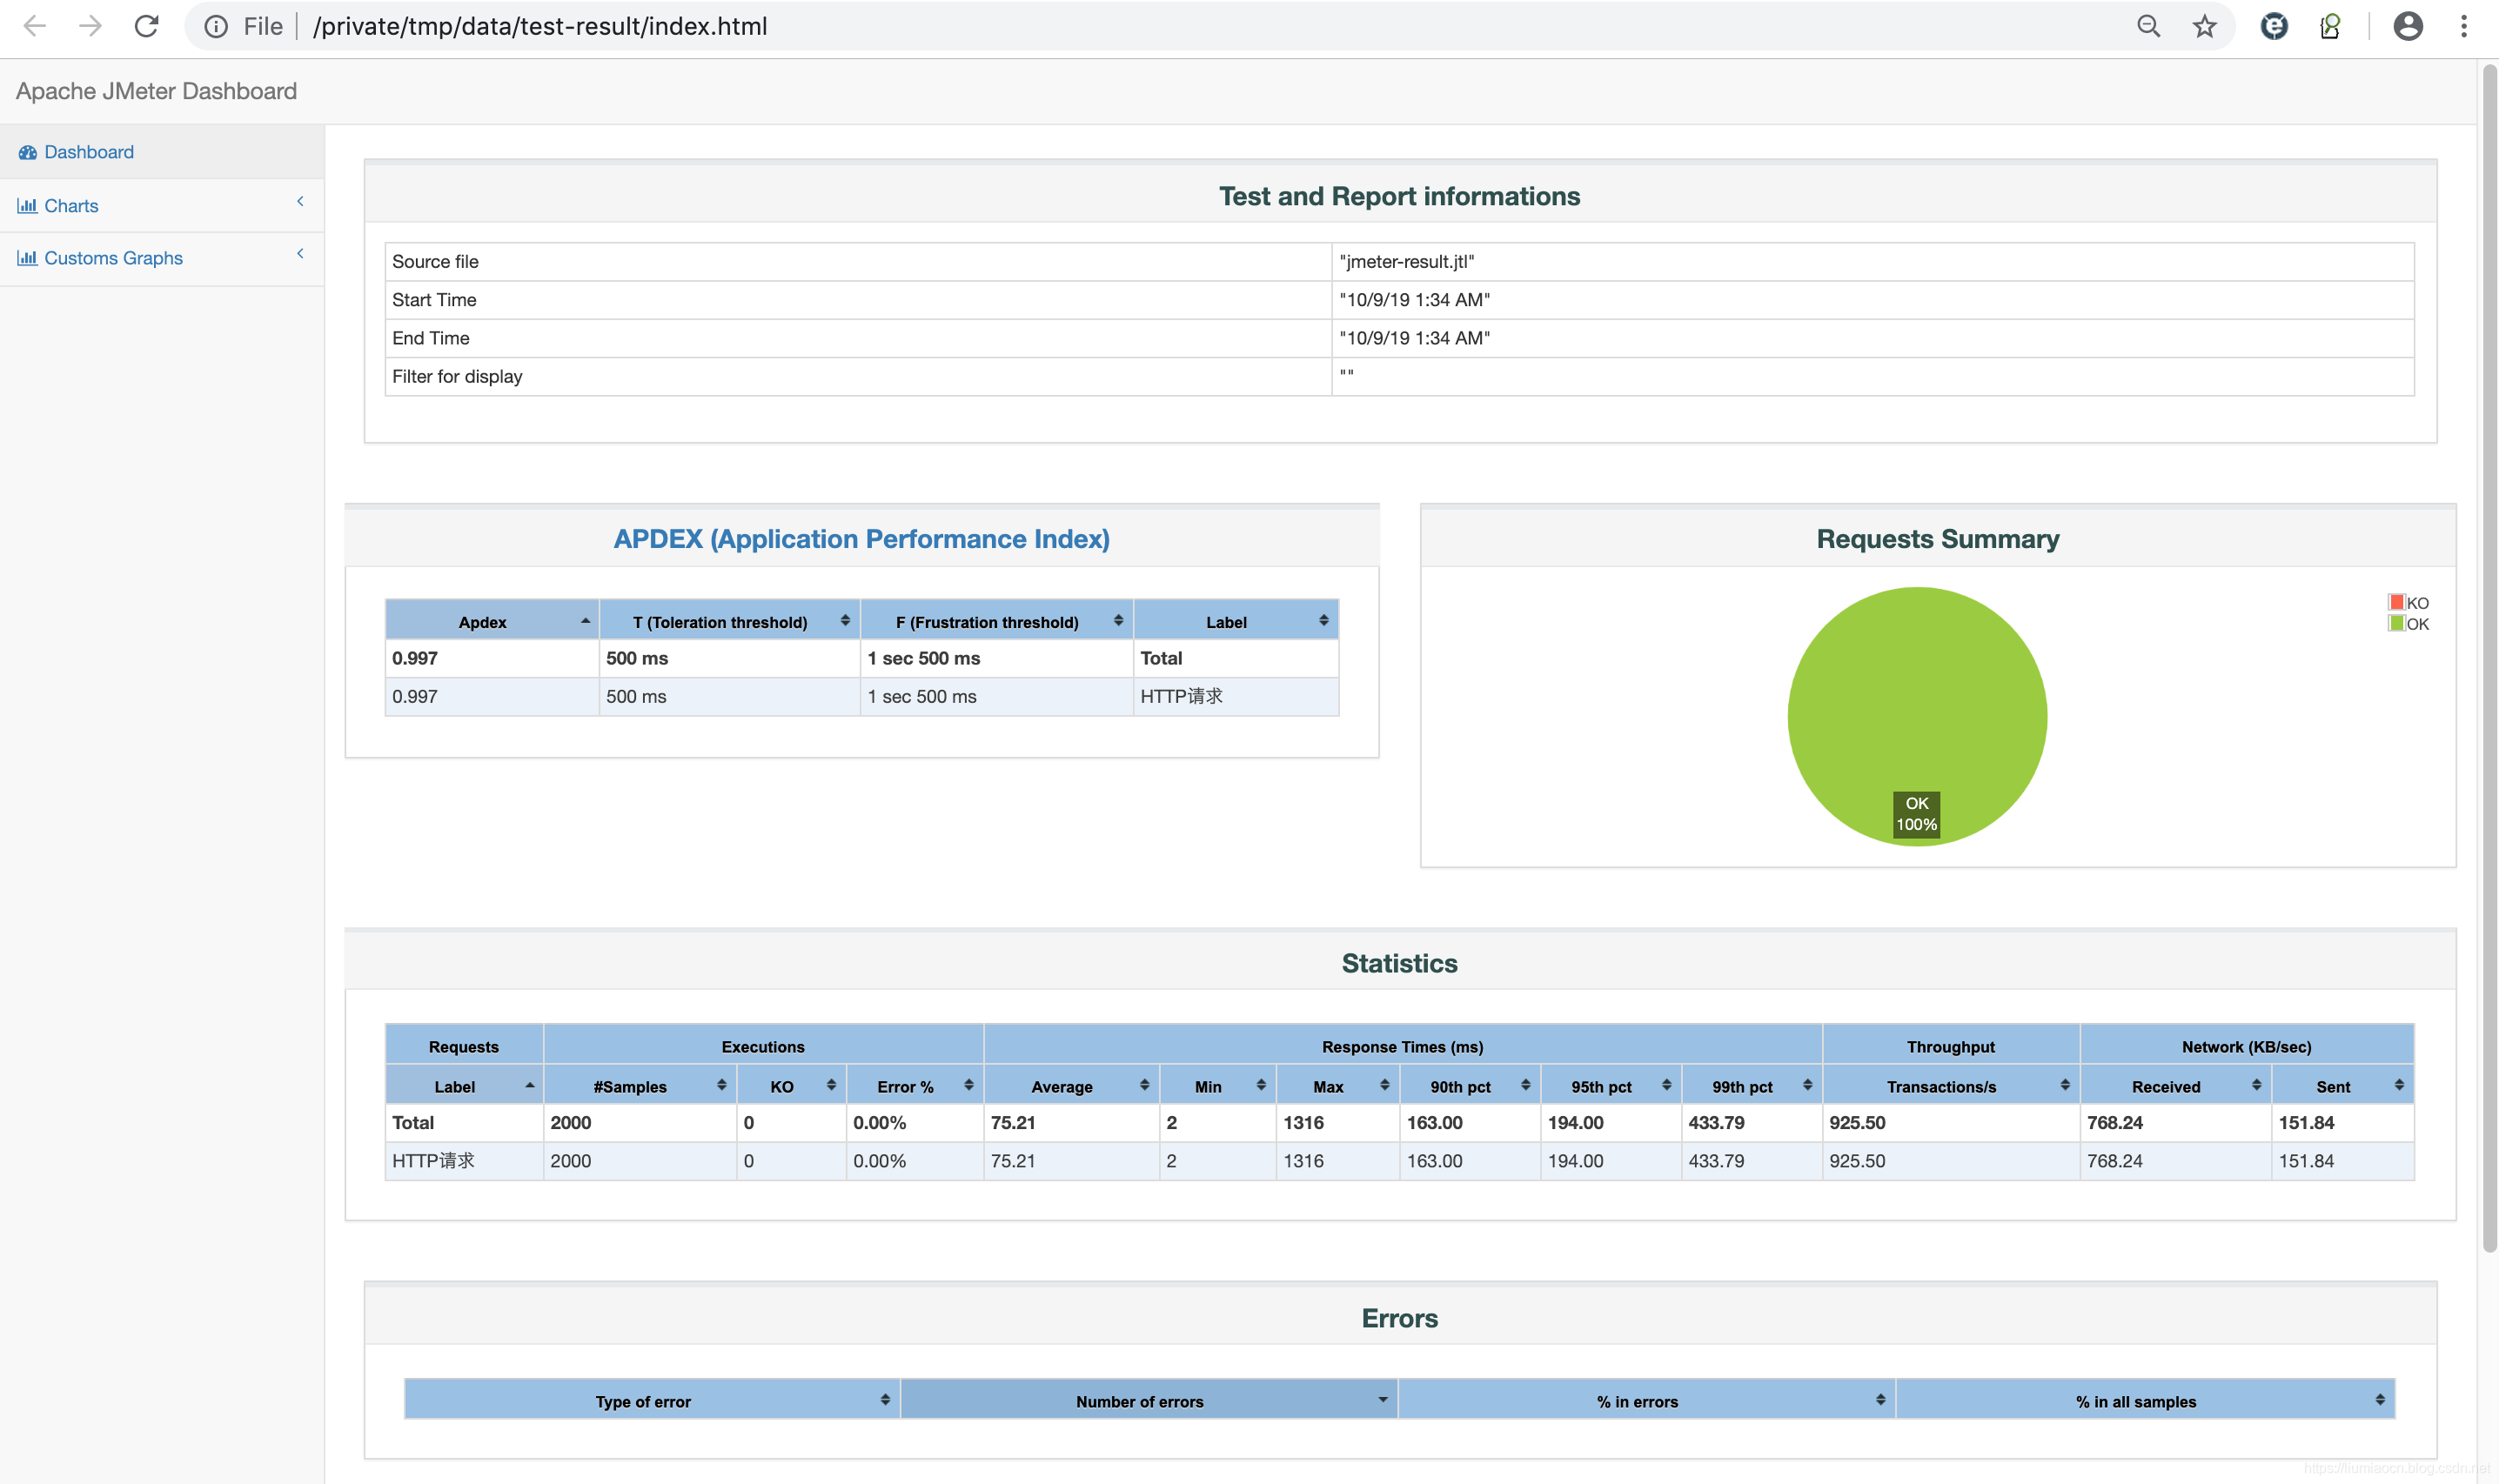
这样我们就通过容器的方式构建了一主三从的压测环境,在这个环境中所谓的Master更像一个Client,所以在很多文章中也把称其为JMeter Client,为了避免理解上的歧义,本文还是称之为Master,因为和很多主从的结构类似,它的主要作用之一在于分发压测内容到Slave节点上,至于此节点是长久运行还是运行时临时启动,则根据具体的需求来进行。
压力测试工具Apache JMeter:11:搭建容器化分布式测试环境
原文:https://www.cnblogs.com/lonelyxmas/p/12205372.html