def plot_demo(image):
    plt.hist(image.ravel(), 256, [0, 256])  # image.ravel()将图像展开,256为bins数量,[0, 256]为范围
plt.show()def image_hist(image):
color = ('blue', 'green', 'red')
for i, color in enumerate(color):
# 计算出直方图,calcHist(images, channels, mask, histSize(有多少个bin), ranges[, hist[, accumulate]]) -> hist
# hist 是一个 256x1 的数组,每一个值代表了与该灰度值对应的像素点数目。
hist = cv.calcHist(image, [i], None, [256], [0, 256])
print(hist.shape)
plt.plot(hist, color=color)
plt.xlim([0, 256])
plt.show()是图像增强的一个手段
def equalHist_demo(image):
    gray = cv.cvtColor(image,cv.COLOR_BGR2GRAY)

    # 全局直方图均衡化,用于增强图像对比度,即黑的更黑,白的更白
    dst = cv.equalizeHist(gray)
    cv.imshow("equalHist_demo", dst)

    # 局部直方图均衡化
    clahe = cv.createCLAHE(clipLimit=2.0, tileGridSize=(8, 8))
    clahe_dst = clahe.apply(gray)
    cv.imshow("clahe", clahe_dst)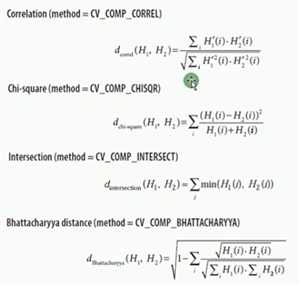
# 创建直方图
def create_rgb_demo(image):
    h, w, c = image.shape
    rgbHist = np.zeros([16*16*16, 1], np.float32)
    bsize = 256 / 16
    for row in range(h):
        for col in range(w):
            b = image[row, col, 0]
            g = image[row, col, 1]
            r = image[row, col, 2]
            index = np.int(b/bsize)*16*16 + np.int(g/bsize)*16 + np.int(r/bsize)
            rgbHist[np.int(index), 0] = rgbHist[np.int(index), 0] + 1

    return rgbHist


# 利用直方图比较相似性,用巴氏和相关性比较好
def hist_compare(image1, image2):
    hist1 = create_rgb_demo(image1)
    hist2 = create_rgb_demo(image2)
    match1 = cv.compareHist(hist1, hist2, method=cv.HISTCMP_BHATTACHARYYA)
    match2 = cv.compareHist(hist1, hist2, method=cv.HISTCMP_CORREL)
    match3 = cv.compareHist(hist1, hist2, method=cv.HISTCMP_CHISQR)
print("巴式距离:%s, 相关性:%s, 卡方:%s"%(match1, match2, match3))原文:https://www.cnblogs.com/wbyixx/p/12241569.html