首先我们来了解一下监控中心是什么?
针对微服务的服务状态包括http请求资源、服务器内存变化(堆、内存、线程、日志管理等)、检测服务配置连接地址是否可用(模拟访问,懒加载情况下)、统计现在有多少个bean(是spring容器中的bean)、统计Spring MVC的@ResultMapping(统计http接口)。
Spring Boot提供了两种监控中心:
Actuator监控应用:没有界面,返回json格式;
AdminUi:底层使用的就是Actuator监控应用,实现可视化的界面;
Actuator是Spring Boot的一个附加功能,可帮助你在应用程序生产环境时监视和管理应用程序。可以使用http的各种请求来监管、审计、收集应用的运行情况,特别对于微服务管理十分有意义。
新建一个项目springboot-actuator,添加依赖:
 <!--  spring-boot-starter-parent  整合第三方常用框架依赖信息(各种引来信息)-->
    <parent>
        <groupId>org.springframework.boot</groupId>
        <artifactId>spring-boot-starter-parent</artifactId>
        <version>2.2.2.RELEASE</version>
    </parent>


    <dependencies>
        <!--  spring-boot-starter-web 是Spring Boot整合Spring MVC Web  -->
        <!--  相当于把第三方常用Maven依赖信息,在parent项目中封装好了,使用Spring Boot提供依赖信息关联整合的Jar包 -->
        <dependency>
            <groupId>org.springframework.boot</groupId>
            <artifactId>spring-boot-starter-web</artifactId>
        </dependency>

        <!--  actuator监控中心  -->
        <dependency>
            <groupId>org.springframework.boot</groupId>
            <artifactId>spring-boot-starter-actuator</artifactId>
        </dependency>

    </dependencies>
新建包com.goldwind.controller,在包下创建IndexController.java:
package com.goldwind.controller;

import org.springframework.web.bind.annotation.RequestMapping;
import org.springframework.web.bind.annotation.RestController;

/**
 * @Author: zy
 * @Description: 控制器
 * @Date: 2020-2-7
 */
@RestController
public class IndexController {

    @RequestMapping("/index")
    public String index(){
        return "index";
    }
}
在src/java/resources下新建application.yml文件:
#通过下面的配置启用所有的监控端点,默认情况下,这些端点是禁用的;
management:
  endpoints:
    web:
      exposure:
        include: "*"
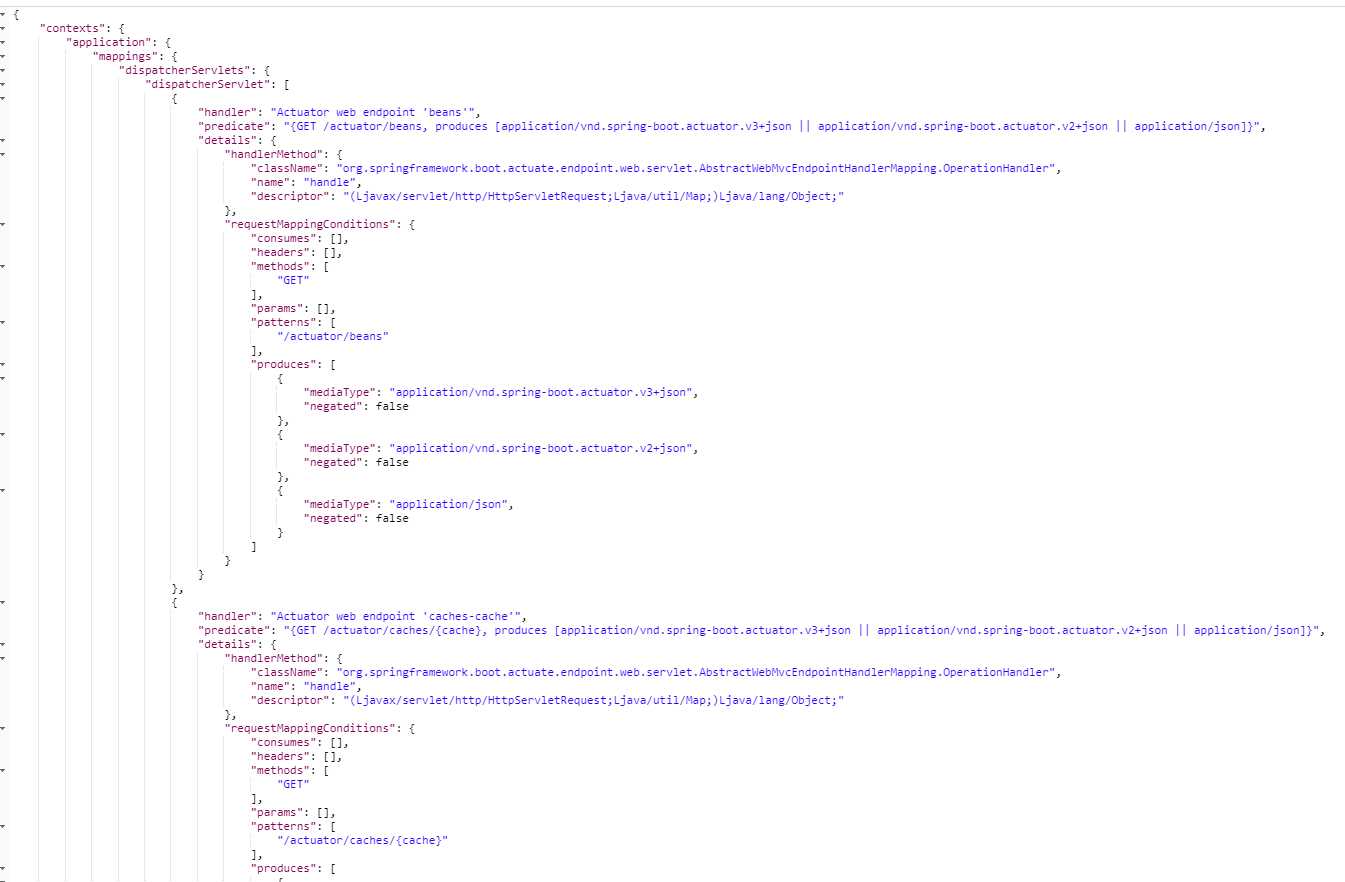
运行程序,访问http://localhost:8080/actuator/mappings可以查看当前支持哪些API请求:
根据端点的作用,可以将spring-boot-starter-actuator模块中原生端点分为三大类:
我们介绍几个常见的原生端点,通过actuator/+端点名就可以获取相应的信息:
|
路径 |
作用 |
|
/actuator/beans |
显示应用程序中所有Spring bean的完整列表。 |
|
/actuator/configprops |
显示所有配置信息。 |
|
/actuator/env |
陈列所有的环境变量。 |
|
/actuator/mappings |
显示所有@RequestMapping的url整理列表。 |
|
/actuator/health |
显示应用程序运行状况信息 up表示成功 down失败 |
|
/actuator/info |
查看自定义应用信息 |
更多相关信息可以参考博客:SpringBoot actuator 应用监控。
原文:https://www.cnblogs.com/zyly/p/12273086.html